PROTECTED SOURCE SCRIPT
Обновлено Mirpapa : MA Lists signal
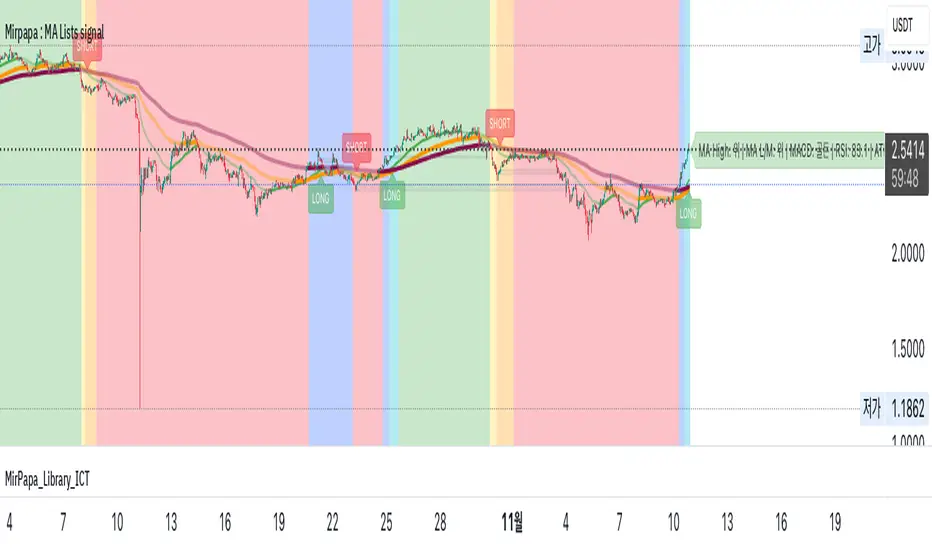
📘 Mirpapa: MA Lists Signal – Simple Guide
🧩 Overview
This indicator displays multiple Moving Averages (MA) with customizable styles and trend signals.
It also includes optional background colors, HTF (Higher Time Frame) MAs, and various technical indicators such as MACD, Stochastic, RSI, and ATR.
⸻
⚙️ Main Settings
• MA Type: Choose between SMA, EMA, WMA, RMA, HMA, EHMA, or THMA.
• Source: Select price source (e.g., hl2, close, open).
• Show Moving Averages: Toggle visibility of MA lines.
⸻
⏱️ MA Periods
Set custom periods for:
• Lowest, Low, Mid, High, Highest, Base
Example: 5 / 10 / 20 / 40 / 100 / 200
Each MA has its own color, line width, and up/down color options.
⸻
⏰ Higher Time Frame (HTF)
• Option to display MAs from another timeframe (e.g., 1D, 4H).
• Set Fast and Slow lengths, line thickness, and colors.
⸻
🎨 Background
• Optional background color to highlight the overall trend.
• Choose trend level (1 to 4) and adjust transparency.
⸻
📦 Signal Boxes
• Display “signal boxes” when key trend or crossover conditions occur.
• Options include:
• Hide closed boxes
• Cooldown period between signals
• Custom box colors and borders
⸻
🎯 Visualization
• Customize label colors for LONG and SHORT signals.
⸻
📈 Indicators
MACD
• Adjustable Fast, Slow, and Signal periods.
• Detects bullish or bearish crossovers.
Stochastic
• Adjustable %K, %D, and smoothing values.
• Detects overbought/oversold conditions.
RSI
• Adjustable RSI and Signal lengths.
• Highlights momentum strength.
ATR
• Adjustable length and filter multiplier.
• Helps identify strong volatility conditions.
⸻
🧮 Logic
• Each MA and indicator uses modular functions for calculation.
• Colors change dynamically depending on trend direction (up/down).
• Optional background shading reflects multi-level MA alignment.
⸻
✅ Summary
This script is a comprehensive trend analysis tool, combining:
• Multiple MA layers
• Trend-based background visualization
• Signal box alerts
• Multi-indicator confirmation (MACD, RSI, Stoch, ATR)
• HTF filtering for precision
Информация о релизе
“MirPapa : MA Lists Signal” is an indicator that visualizes multiple moving averages (MAs) and trend-based background signals.It supports various MA types (SMA, EMA, WMA, etc.) and color-codes each MA (Lowest → Base) by direction.
It includes optional background coloring to show short-, mid-, or long-term trends.
Users can also display signal boxes for breakout zones, with custom colors and cooldown control.
The script adds common indicators — MACD, Stochastic, RSI, and ATR — for momentum and volatility filtering.
Higher-timeframe MAs can also be shown for trend confirmation.
Overall, it’s a comprehensive trend and signal visualization tool combining MAs and oscillator logic for clear trading context.
Скрипт с защищённым кодом
Этот скрипт опубликован с закрытым исходным кодом. Однако вы можете использовать его свободно и без каких-либо ограничений — читайте подробнее здесь.
Отказ от ответственности
Все виды контента, которые вы можете увидеть на TradingView, не являются финансовыми, инвестиционными, торговыми или любыми другими рекомендациями. Мы не предоставляем советы по покупке и продаже активов. Подробнее — в Условиях использования TradingView.