OPEN-SOURCE SCRIPT
Обновлено Rational Root Timeline

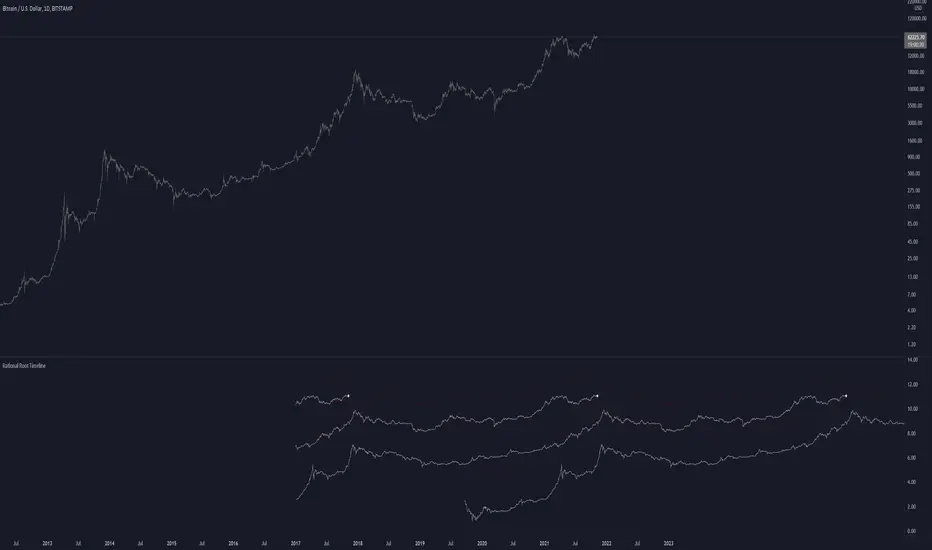
This script is based on RationalRoot's spiral btc chart. Since I dont know how to make spirals in pinescript I just flattened it out into a readable chart. All this shows is the log price for btc over a 4 year timeframe. I found it interesting how well things line up with this idea. The white circle just shows the current day price location. You need to be on the Daily timeframe to view this correctly.
Информация о релизе
Added a prediction line that accounts for diminishing returns. Not sure about the correct values but eh here ya goСкрипт с открытым кодом
В истинном духе TradingView, создатель этого скрипта сделал его открытым исходным кодом, чтобы трейдеры могли проверить и убедиться в его функциональности. Браво автору! Вы можете использовать его бесплатно, но помните, что перепубликация кода подчиняется нашим Правилам поведения.
Отказ от ответственности
Информация и публикации не предназначены для предоставления и не являются финансовыми, инвестиционными, торговыми или другими видами советов или рекомендаций, предоставленных или одобренных TradingView. Подробнее читайте в Условиях использования.
Скрипт с открытым кодом
В истинном духе TradingView, создатель этого скрипта сделал его открытым исходным кодом, чтобы трейдеры могли проверить и убедиться в его функциональности. Браво автору! Вы можете использовать его бесплатно, но помните, что перепубликация кода подчиняется нашим Правилам поведения.
Отказ от ответственности
Информация и публикации не предназначены для предоставления и не являются финансовыми, инвестиционными, торговыми или другими видами советов или рекомендаций, предоставленных или одобренных TradingView. Подробнее читайте в Условиях использования.