Выбор редакцииOPEN-SOURCE SCRIPT
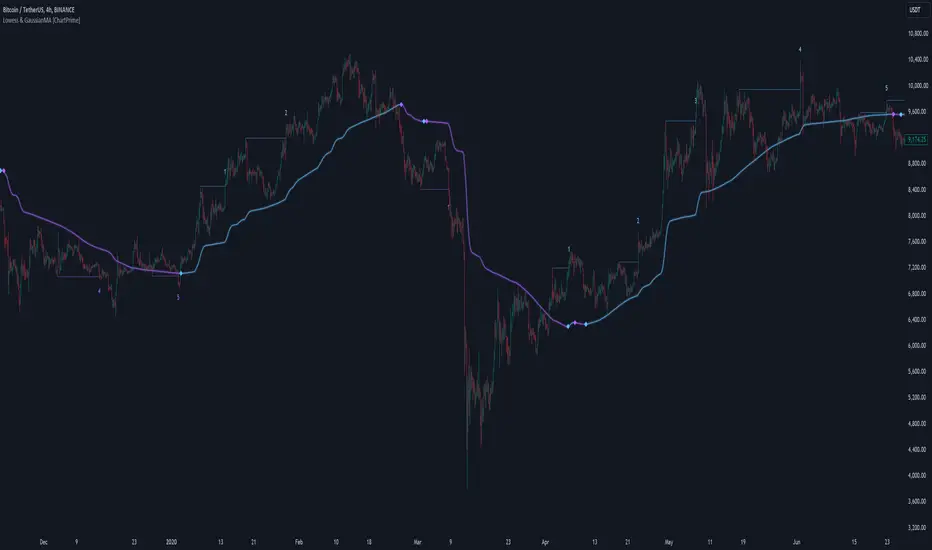
LOWESS (Locally Weighted Scatterplot Smoothing) [ChartPrime]

LOWESS (Locally Weighted Scatterplot Smoothing) [ChartPrime]
⯁ OVERVIEW
The LOWESS (Locally Weighted Scatterplot Smoothing) [ChartPrime] indicator is an advanced technical analysis tool that combines LOWESS smoothing with a Modified Adaptive Gaussian Moving Average. This indicator provides traders with a sophisticated method for trend analysis, pivot point identification, and breakout detection.
◆ KEY FEATURES
◆ FUNCTIONALITY DETAILS
⬥ LOWESS Calculation:
⬥ Modified Adaptive Gaussian Moving Average:
⬥ Pivot Point Detection and Visualization:
⬥ Breakout Tracking:
◆ USAGE
⯁ USER INPUTS
⯁ TECHNICAL NOTES
The LOWESS (Locally Weighted Scatterplot Smoothing) [ChartPrime] indicator offers traders a sophisticated tool for trend analysis and breakout detection. By combining advanced smoothing techniques with pivot point analysis, it provides a comprehensive view of market dynamics. The indicator's adaptability to different market conditions and its customizable nature make it suitable for various trading styles and timeframes.
⯁ OVERVIEW
The LOWESS (Locally Weighted Scatterplot Smoothing) [ChartPrime] indicator is an advanced technical analysis tool that combines LOWESS smoothing with a Modified Adaptive Gaussian Moving Average. This indicator provides traders with a sophisticated method for trend analysis, pivot point identification, and breakout detection.
◆ KEY FEATURES
- LOWESS Smoothing: Implements Locally Weighted Scatterplot Smoothing for trend analysis.
- Modified Adaptive Gaussian Moving Average: Incorporates a volatility-adapted Gaussian MA for enhanced trend detection.
- Pivot Point Identification: Detects and visualizes significant pivot highs and lows.
- Breakout Detection: Tracks and optionally displays the count of consecutive breakouts.
- Gaussian Scatterplot: Offers a unique visualization of price movements using randomly colored points.
- Customizable Parameters: Allows users to adjust calculation length, pivot detection, and visualization options.
◆ FUNCTIONALITY DETAILS
⬥ LOWESS Calculation:
- Utilizes a weighted local regression to smooth price data.
- Adapts to local trends, reducing noise while preserving important price movements.
⬥ Modified Adaptive Gaussian Moving Average:
- Combines Gaussian weighting with volatility adaptation using ATR and standard deviation.
- Smooths the Gaussian MA using LOWESS for enhanced trend visualization.
⬥ Pivot Point Detection and Visualization:
- Identifies pivot highs and lows using customizable left and right bar counts.
- Draws lines and labels to mark broke pivot points on the chart.
⬥ Breakout Tracking:
- Monitors price crossovers of pivot lines to detect breakouts.
- Optionally displays and updates the count of consecutive breakouts.
◆ USAGE
- Trend Analysis: Use the color and direction of the smoothed Gaussian MA line to identify overall trend direction.
- Breakout Trading: Monitor breakouts from pivot levels and their persistence using the breakout count feature.
- Volatility Assessment: The spread of the Gaussian scatterplot can provide insights into market volatility.
⯁ USER INPUTS
- Length: Sets the lookback period for LOWESS and Gaussian MA calculations (default: 30).
- Pivot Length: Determines the number of bars to the left for pivot calculation (default: 5).
- Count Breaks: Toggle to show the count of consecutive breakouts (default: false).
- Gaussian Scatterplot: Toggle to display the Gaussian MA as a scatterplot (default: true).
⯁ TECHNICAL NOTES
- Implements a custom LOWESS function for efficient local regression smoothing.
- Uses a modified Gaussian MA calculation that adapts to market volatility.
- Employs Pine Script's line and label drawing capabilities for clear pivot point visualization.
- Utilizes random color generation for the Gaussian scatterplot to enhance visual distinction between different time periods.
The LOWESS (Locally Weighted Scatterplot Smoothing) [ChartPrime] indicator offers traders a sophisticated tool for trend analysis and breakout detection. By combining advanced smoothing techniques with pivot point analysis, it provides a comprehensive view of market dynamics. The indicator's adaptability to different market conditions and its customizable nature make it suitable for various trading styles and timeframes.
Информация о релизе
Patched functionality on stocksСкрипт с открытым кодом
В истинном духе TradingView, создатель этого скрипта сделал его открытым исходным кодом, чтобы трейдеры могли проверить и убедиться в его функциональности. Браво автору! Вы можете использовать его бесплатно, но помните, что перепубликация кода подчиняется нашим Правилам поведения.
Отказ от ответственности
Информация и публикации не предназначены для предоставления и не являются финансовыми, инвестиционными, торговыми или другими видами советов или рекомендаций, предоставленных или одобренных TradingView. Подробнее читайте в Условиях использования.
Скрипт с открытым кодом
В истинном духе TradingView, создатель этого скрипта сделал его открытым исходным кодом, чтобы трейдеры могли проверить и убедиться в его функциональности. Браво автору! Вы можете использовать его бесплатно, но помните, что перепубликация кода подчиняется нашим Правилам поведения.
Отказ от ответственности
Информация и публикации не предназначены для предоставления и не являются финансовыми, инвестиционными, торговыми или другими видами советов или рекомендаций, предоставленных или одобренных TradingView. Подробнее читайте в Условиях использования.