OPEN-SOURCE SCRIPT
Обновлено Seasonality
This is my attempt to bring an open source Seasonality indicator to TradingView.
There are still outstanding issues I couldn't figure out, so I am hoping some more seasoned Pine Script coders can take the lead from here.
What is Seasonality: https://www.investopedia.com/terms/s/seasonality.asp
How to Use
Known Issues
Areas for Improvement
There are still outstanding issues I couldn't figure out, so I am hoping some more seasoned Pine Script coders can take the lead from here.
What is Seasonality: https://www.investopedia.com/terms/s/seasonality.asp
How to Use
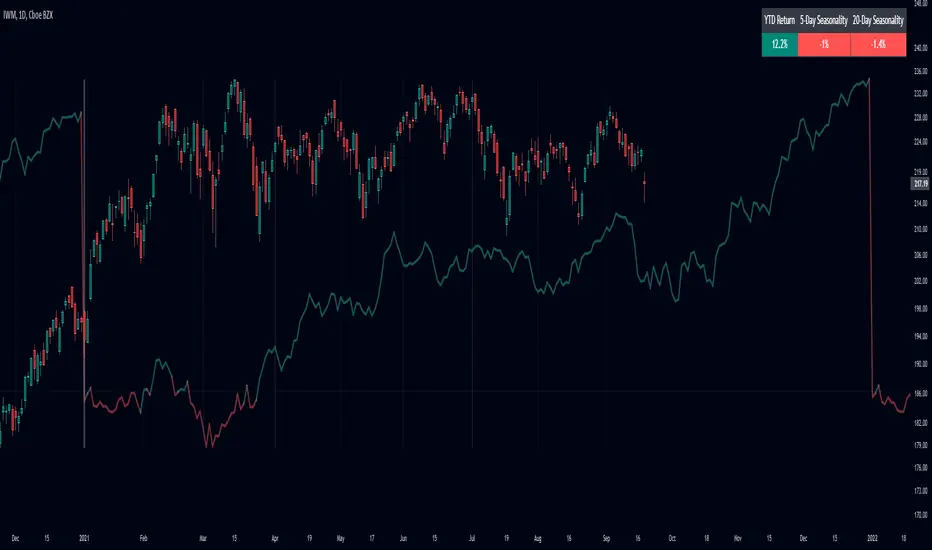
- The indicator plots the avg % change per bar for all complete years, up to 20 years back.
- It will only show in the daily resolution.
- For charts with more data, you need to scroll back a bit to get the line to display.
- Use Offset Adjust in the menu for charts that do not align perfectly to the start of the year.
- Use Smoothing in the menu to apply an EMA to the line.
- The panel shows YTD % gain, 5-day rolling seasonality, and 20-day rolling seasonality.
Known Issues
- Does not work for tickers with over 10,000 bars of data.
- Some tickers do not align correctly.
- Only works with tickers that have ~252 bars a year.
Areas for Improvement
- Figure out a way to use barssince() to get the precise amount of bars for each year. This will make the seasonality calculation and automatic offset more accurate.
- Have an option for calendar week, month, and year seasonality.
Информация о релизе
Cleaned up the script.Информация о релизе
Cleaned up the code some more so it is easier to read.Скрипт с открытым кодом
В истинном духе TradingView, создатель этого скрипта сделал его открытым исходным кодом, чтобы трейдеры могли проверить и убедиться в его функциональности. Браво автору! Вы можете использовать его бесплатно, но помните, что перепубликация кода подчиняется нашим Правилам поведения.
Отказ от ответственности
Информация и публикации не предназначены для предоставления и не являются финансовыми, инвестиционными, торговыми или другими видами советов или рекомендаций, предоставленных или одобренных TradingView. Подробнее читайте в Условиях использования.
Скрипт с открытым кодом
В истинном духе TradingView, создатель этого скрипта сделал его открытым исходным кодом, чтобы трейдеры могли проверить и убедиться в его функциональности. Браво автору! Вы можете использовать его бесплатно, но помните, что перепубликация кода подчиняется нашим Правилам поведения.
Отказ от ответственности
Информация и публикации не предназначены для предоставления и не являются финансовыми, инвестиционными, торговыми или другими видами советов или рекомендаций, предоставленных или одобренных TradingView. Подробнее читайте в Условиях использования.