OPEN-SOURCE SCRIPT
Обновлено Relative Performance Spread
**Relative Performance Spread Indicator – Overview**
This indicator compares the **relative performance between two stocks** by normalizing their prices and calculating the **spread**, **area under the curve (AUC)**, or **normalized price ratio**.
### **How It Works**
* **Input**: Select a second stock (`ticker2`) and a moving average window.
* **Normalization**: Each stock is normalized by its own moving average → `norm = close / MA`.
* **Spread**: The difference `spread = norm1 - norm2` reflects which stock is outperforming.
* **AUC**: Cumulative spread over time shows prolonged dominance or underperformance.
* **Bounds**: Bollinger-style bands are drawn around the spread to assess deviation extremes.
### **Usage**
* **Plot Type Options**:
* `"Spread"`: Spot outperformance; crossing bands may signal rotation.
* `"AUC"`: Track long-term relative trend dominance.
* `"Normalized"`: Directly compare scaled price movements.
Use this tool for **pair trading**, **relative momentum**, or **rotation strategies**. It adapts well across assets with different price scales.
Информация о релизе
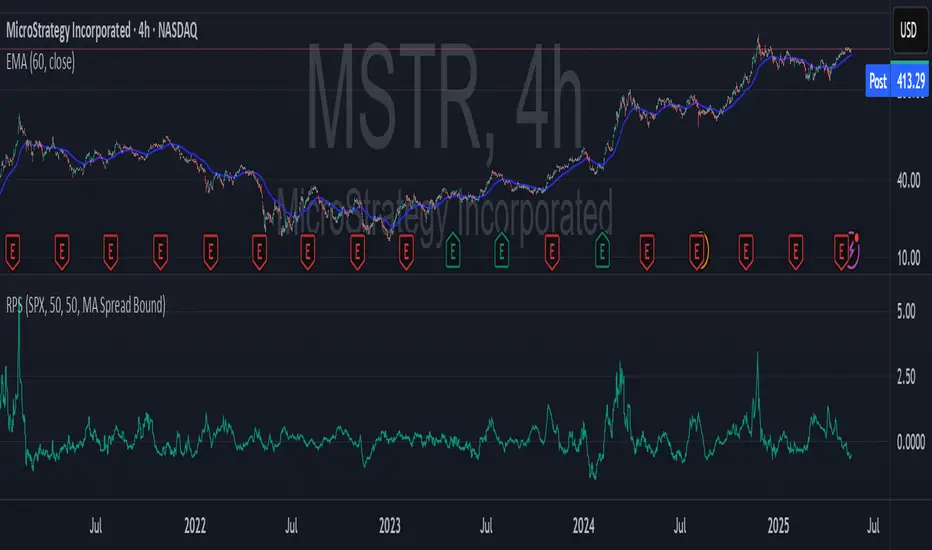
This indicator compares the performance of two stocks by analyzing their deviation from their own moving averages. It offers five plot modes:Spread: Shows the difference between the normalized prices of Stock 1 and Stock 2.
AUC (Area Under Curve): Cumulative spread over time, useful for detecting persistent out/underperformance.
Normalized: Plots each stock’s price relative to its moving average.
Z-Score Spread: Compares standardized deviations to highlight extreme divergences.
MA Spread Bound: Dynamically scales each stock’s deviation within upper/lower EMA bounds for robust comparison.
Скрипт с открытым кодом
В истинном духе TradingView, создатель этого скрипта сделал его открытым исходным кодом, чтобы трейдеры могли проверить и убедиться в его функциональности. Браво автору! Вы можете использовать его бесплатно, но помните, что перепубликация кода подчиняется нашим Правилам поведения.
Отказ от ответственности
Информация и публикации не предназначены для предоставления и не являются финансовыми, инвестиционными, торговыми или другими видами советов или рекомендаций, предоставленных или одобренных TradingView. Подробнее читайте в Условиях использования.