OPEN-SOURCE SCRIPT
Heikin-Ashi Band Proximity Indicator
Heikin-Ashi Band Proximity Indicator
Overview:
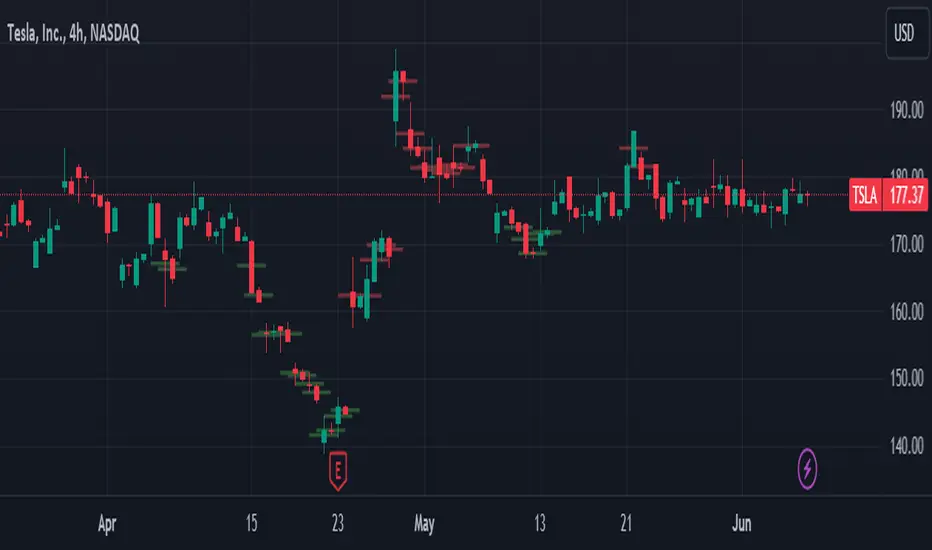
The Heikin-Ashi Band Proximity Indicator is a an analytical tool engineered to pinpoint critical price junctures where the Heikin-Ashi closing values align with the upper and lower thresholds of the Dynamic Adaptive Regression Bands. This indicator delineates these intersections through distinct green and red lines plotted over the last 100 candles, demarcating prospective support and resistance zones.
Purpose:
This indicator helps traders identify potential buy and sell zones based on proximity to dynamically calculated bands using Heikin-Ashi smoothed prices combined with linear regression and standard deviation calculations.
How It Works:
- Heikin-Ashi Transformation: Smooths price data to help isolate trends and reversals, reducing market noise and highlighting clearer trends.
- Regression Bands: Calculates the central regression line and deviations to form adaptive bands that act as dynamic levels of support and resistance.
- Color-Coded Indications: Green lines typically denote zones where prices may receive upward support, enhancing the likelihood of a price increase, while red lines suggest probable resistance zones where price pullbacks or stagnation are anticipated.
Trading Potential Application:
- Buy Signal: When the Heikin-Ashi close approaches the lower green band, it might indicate a potential upward reversal.
- Sell Signal: Conversely, proximity to the upper red band may suggest a downward reversal.
- Market Behavior: When prices diverge from these bands without surpassing them, they frequently revert to these levels, indicating that the bands serve as persistent attractors of price, exerting a gravitational pull over extended periods. This behavior underscores the bands' role in stabilizing price movements by establishing persistent points of reversion within the market's volatility landscape.
Calculation Details:
- ha_close is computed as the average of the open, high, low, and close, which smoothens the price series.
- Regression lines and deviations are calculated to create bands that adapt to recent price actions, providing dynamic support and resistance levels.
Usage:
Useful for traders looking for an indicator to enhance their decision-making by identifying potential entry and exit points based on price stability and volatility. The clear, color-coded system aids in quick decision-making under various market conditions.
Conclusion:
The Heikin-Ashi Band Proximity Indicator is invaluable for traders aiming to capitalize on price movements near critical levels. Its methodology provides a unique approach to understanding market dynamics and enhancing trading strategies.
Overview:
The Heikin-Ashi Band Proximity Indicator is a an analytical tool engineered to pinpoint critical price junctures where the Heikin-Ashi closing values align with the upper and lower thresholds of the Dynamic Adaptive Regression Bands. This indicator delineates these intersections through distinct green and red lines plotted over the last 100 candles, demarcating prospective support and resistance zones.
Purpose:
This indicator helps traders identify potential buy and sell zones based on proximity to dynamically calculated bands using Heikin-Ashi smoothed prices combined with linear regression and standard deviation calculations.
How It Works:
- Heikin-Ashi Transformation: Smooths price data to help isolate trends and reversals, reducing market noise and highlighting clearer trends.
- Regression Bands: Calculates the central regression line and deviations to form adaptive bands that act as dynamic levels of support and resistance.
- Color-Coded Indications: Green lines typically denote zones where prices may receive upward support, enhancing the likelihood of a price increase, while red lines suggest probable resistance zones where price pullbacks or stagnation are anticipated.
Trading Potential Application:
- Buy Signal: When the Heikin-Ashi close approaches the lower green band, it might indicate a potential upward reversal.
- Sell Signal: Conversely, proximity to the upper red band may suggest a downward reversal.
- Market Behavior: When prices diverge from these bands without surpassing them, they frequently revert to these levels, indicating that the bands serve as persistent attractors of price, exerting a gravitational pull over extended periods. This behavior underscores the bands' role in stabilizing price movements by establishing persistent points of reversion within the market's volatility landscape.
Calculation Details:
- ha_close is computed as the average of the open, high, low, and close, which smoothens the price series.
- Regression lines and deviations are calculated to create bands that adapt to recent price actions, providing dynamic support and resistance levels.
Usage:
Useful for traders looking for an indicator to enhance their decision-making by identifying potential entry and exit points based on price stability and volatility. The clear, color-coded system aids in quick decision-making under various market conditions.
Conclusion:
The Heikin-Ashi Band Proximity Indicator is invaluable for traders aiming to capitalize on price movements near critical levels. Its methodology provides a unique approach to understanding market dynamics and enhancing trading strategies.
Скрипт с открытым кодом
В истинном духе TradingView, создатель этого скрипта сделал его открытым исходным кодом, чтобы трейдеры могли проверить и убедиться в его функциональности. Браво автору! Вы можете использовать его бесплатно, но помните, что перепубликация кода подчиняется нашим Правилам поведения.
Отказ от ответственности
Информация и публикации не предназначены для предоставления и не являются финансовыми, инвестиционными, торговыми или другими видами советов или рекомендаций, предоставленных или одобренных TradingView. Подробнее читайте в Условиях использования.