OPEN-SOURCE SCRIPT
Обновлено CARNAC Trading - Dynamic Support and Resistance Levels
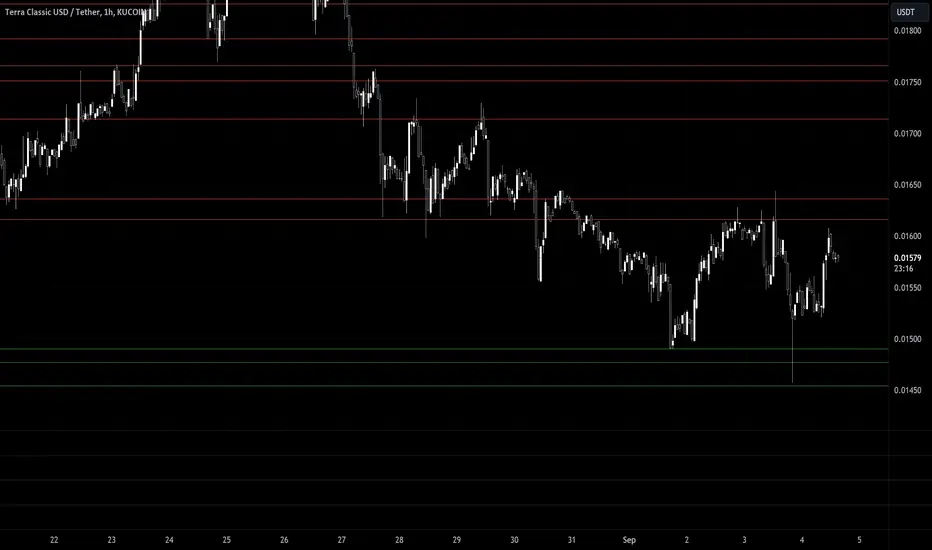
The **CARNAC Trading - Dynamic Support and Resistance Levels** indicator is designed to help traders identify key support and resistance levels on any chart timeframe. This indicator dynamically detects major support and resistance levels based on historical price pivots and displays them as lines on the chart. The levels are color-coded for easy identification—**green lines** represent support levels below the current price, while **red lines** represent resistance levels above the current price.
Key Features:
- Dynamic Support/Resistance Detection**: Automatically identifies the strongest support and resistance levels on the chart.
- Timeframe Selection**: Allows users to choose a specific timeframe for detecting support and resistance levels, independent of the chart's timeframe.
- Pivot Strength and Lookback Period**: Customizable inputs to control how far back the indicator looks and how strong the pivots need to be for support/resistance detection.
- Level Limitation**: Limits the number of support and resistance lines to keep charts clean, ensuring only the most relevant levels are displayed.
---
How to Use the Indicator:
Inputs and Settings:
1. **Lookback Period**: Defines how many bars back the indicator will consider for detecting support and resistance levels. You can adjust this depending on how much historical data you want to include. A larger value will capture more significant levels, while a smaller value focuses on more recent price action.
2. **Pivot Strength**: This setting determines how significant a high or low must be to qualify as a pivot. A higher pivot strength will capture stronger, more critical levels, while a lower value will detect more frequent, minor pivots.
3. **Max Levels Above/Below Price**: This controls the maximum number of support and resistance levels displayed on each side of the current price. Keeping this number low helps reduce clutter and focuses on the most important levels.
4. **Timeframe for Support/Resistance Detection**: Select the timeframe used for detecting support and resistance levels, which can differ from the chart's timeframe. This is helpful when you're trading on shorter timeframes but want to see key levels from a higher timeframe (e.g., detecting daily levels while trading intraday).
---
Visualization:
- **Green Lines**: Represent support levels below the current price. These are potential areas where buying interest may increase, and the price could bounce upwards.
- **Red Lines**: Represent resistance levels above the current price. These are potential areas where selling interest may increase, and the price could fall downwards.
---
Example Usage:
1. **Identifying Support and Resistance Zones**: Use this indicator to identify critical support and resistance zones. These are areas where the price has historically reversed or paused, making them ideal for setting entry, exit, stop-loss, or take-profit levels.
2. **Trend Analysis**: By observing which side of the current price the majority of lines are on (more red or more green), traders can gauge whether the market is facing more resistance or support, helping them align with the current trend.
3. **Timeframe Flexibility**: You can choose to detect support and resistance levels from higher timeframes (e.g., Daily or Weekly) while trading on lower timeframes (e.g., 15-minute or 1-hour charts). This gives you a macro-level view of key price levels while executing trades on the micro-level.
---
Recommendations:
- **Swing Traders**: Use this indicator with a larger lookback period and higher pivot strength to capture major long-term support and resistance levels.
- **Scalpers and Intraday Traders**: Use shorter lookback periods and lower pivot strengths to detect key levels within a shorter timeframe.
By customizing the inputs and tailoring them to your trading style, this indicator can provide valuable insights into price levels where significant buying or selling activity is likely to occur, helping you make more informed trading decisions.
Информация о релизе
This script has repainting issues - please do not use. TradingView does not let me delete it, unfortunately.Скрипт с открытым кодом
В истинном духе TradingView, создатель этого скрипта сделал его открытым исходным кодом, чтобы трейдеры могли проверить и убедиться в его функциональности. Браво автору! Вы можете использовать его бесплатно, но помните, что перепубликация кода подчиняется нашим Правилам поведения.
Отказ от ответственности
Информация и публикации не предназначены для предоставления и не являются финансовыми, инвестиционными, торговыми или другими видами советов или рекомендаций, предоставленных или одобренных TradingView. Подробнее читайте в Условиях использования.
Скрипт с открытым кодом
В истинном духе TradingView, создатель этого скрипта сделал его открытым исходным кодом, чтобы трейдеры могли проверить и убедиться в его функциональности. Браво автору! Вы можете использовать его бесплатно, но помните, что перепубликация кода подчиняется нашим Правилам поведения.
Отказ от ответственности
Информация и публикации не предназначены для предоставления и не являются финансовыми, инвестиционными, торговыми или другими видами советов или рекомендаций, предоставленных или одобренных TradingView. Подробнее читайте в Условиях использования.