OPEN-SOURCE SCRIPT
RSI [XP]
RSI [XP]
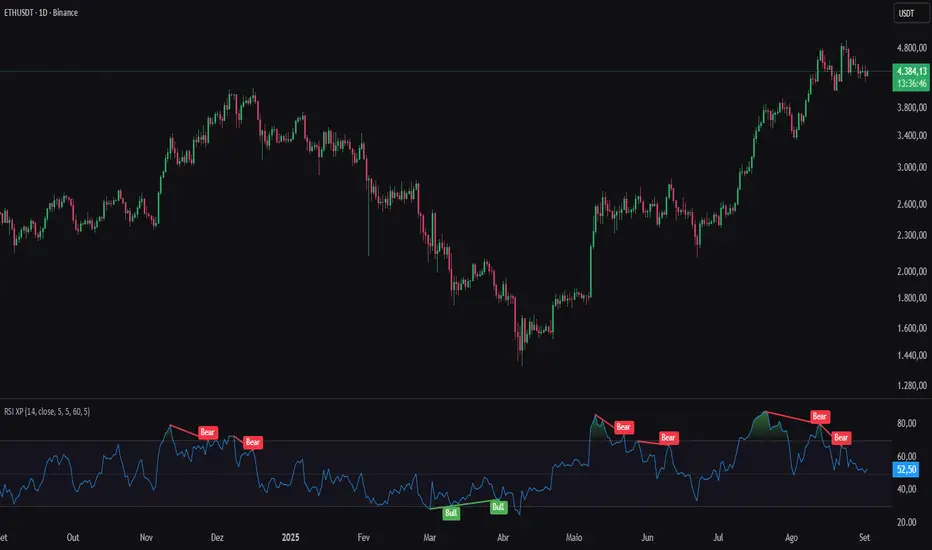
This script displays the Relative Strength Index (RSI) with advanced visualization options, including:
• Standard RSI calculation with customizable timeframe and source
• Bollinger Bands applied to the RSI for volatility context
• Smoothing moving averages (SMA, EMA, RMA, WMA, VWMA) applied to the RSI
• Identification of regular divergences (bullish and bearish), with automatic alerts
Ideal for traders who want clear visual signals, refined technical interpretation, and objective alerts based on classic divergence patterns.
Скрипт с открытым кодом
В истинном духе TradingView автор этого скрипта опубликовал его с открытым исходным кодом, чтобы трейдеры могли понять, как он работает, и проверить на практике. Вы можете воспользоваться им бесплатно, но повторное использование этого кода в публикации регулируется Правилами поведения.
Отказ от ответственности
Все виды контента, которые вы можете увидеть на TradingView, не являются финансовыми, инвестиционными, торговыми или любыми другими рекомендациями. Мы не предоставляем советы по покупке и продаже активов. Подробнее — в Условиях использования TradingView.