PROTECTED SOURCE SCRIPT
LIQUID-VOL-DISP-INDIC

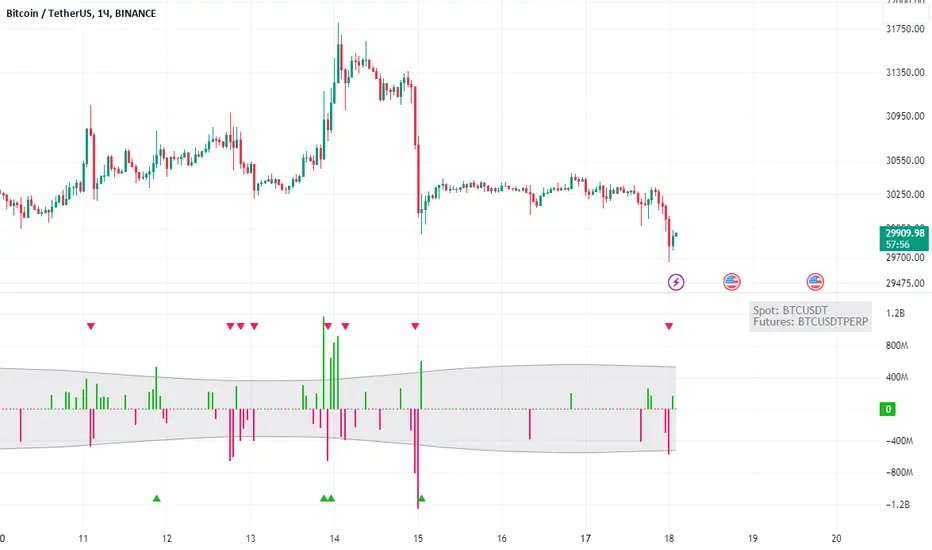
The "Liquidation Volume Disparity Indicator" indicator, is a tool designed to analyze the volume disparity between spot and futures markets. It aims to identify potential liquidation events that may have occurred based on the difference in trading volume.
The indicator calculates the difference between the volume of the spot market and the volume of the futures market. Positive values indicate a higher volume in the futures market compared to the spot market, while negative values suggest higher volume in the spot market.
Key Features:
Automatic Ticker Detection: The indicator can dynamically detect the spot and futures markets corresponding to the current symbol, ensuring accurate data representation.
Binance as the Default Source: By default, Binance is used as the data source for perpetuals. This can be overridden if needed.
Manual Ticker Selection: Users have the flexibility to manually select the symbols for the spot and futures markets if autodetection is disabled.
Stop-Loss Level Adjustment: The indicator allows users to adjust the stop-loss level based on the average band of liquidations. By increasing the multiplier, the stop-loss level can be set higher than the average, providing risk management flexibility.
Aesthetic Customization: Users can customize the color scheme for long and short liquidations, choose to display spot and futures market volumes, and adjust various visual elements for enhanced readability.
By plotting the liquidation volume disparity on the chart, the indicator provides valuable insights into potential market dynamics. Traders can utilize this information to better understand the relationship between spot and futures markets, identify possible liquidation events, and potentially incorporate it into their trading strategies.
Additionally, the indicator generates alerts for long and short exit signals based on the detected stop-loss levels, providing timely notifications to traders for potential trade management actions.
Скрипт с защищённым кодом
Этот скрипт опубликован с закрытым исходным кодом. Однако вы можете использовать его свободно и без каких-либо ограничений — читайте подробнее здесь.
Отказ от ответственности
Все виды контента, которые вы можете увидеть на TradingView, не являются финансовыми, инвестиционными, торговыми или любыми другими рекомендациями. Мы не предоставляем советы по покупке и продаже активов. Подробнее — в Условиях использования TradingView.