DCT - Liquidity Heatmap - Pro
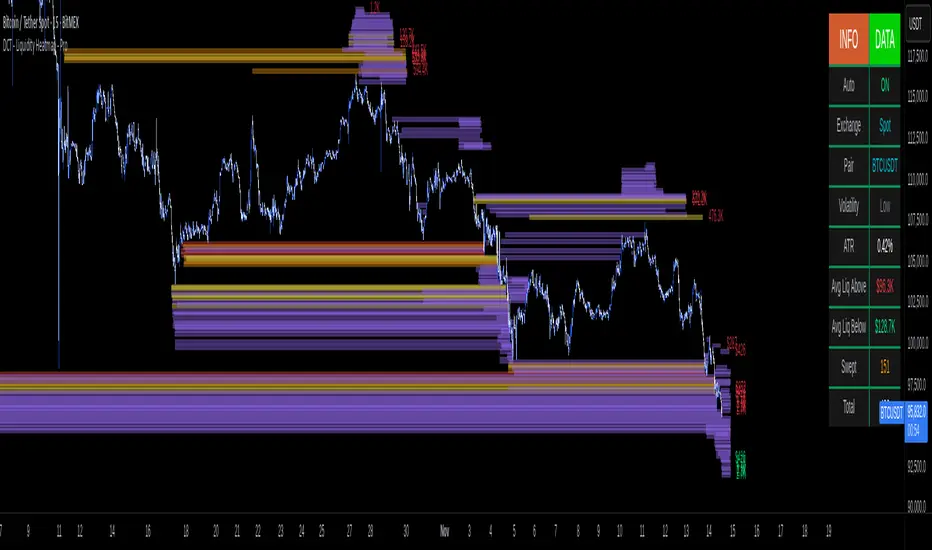
This indicator visualizes liquidity levels by analyzing volume intensity, order flow structure, and price interaction. It highlights areas where buy-side and sell-side liquidity builds up, showing potential zones of interest.
WHAT IT DOES
- Detects buy-side and sell-side liquidity levels
- Tracks swept zones
- Displays volume intensity using a color-graded system
- Optional CVD mode showing directional volume bias
- Adapts automatically to different market types and volatility states
- Extends active levels forward
- Cleans up old data automatically
- Includes optional alert conditions
KEY FEATURES
- Automatic market and volatility identification
- Smart spacing and level management
- Optional CVD tracking
- Forward level projection
- Swept level preservation
- Imbalance markers
- Real-time info table with liquidity stats, volatility state, and level counts
- Memory-optimized handling for long charts
IMPORTANT NOTES
- Not a predictive tool
- Not a standalone trading system
- Effectiveness varies by timeframe and data quality
- Optimized for crypto markets
- Historical visualization shows past detected levels
HOW TO USE
- Add indicator to your chart
- Adjust spacing to widen or tighten clusters
- Enable CVD if directional pressure is needed
- Configure alerts if desired
- Use Compact mode on smaller screens
TECHNICAL DETAILS
- Pine v6
- Overlay: true
- Max boxes: 500
- Memory optimized
- Works on Perpetual and Spot crypto markets
DISCLAIMER
For analysis and educational use only. No financial advice. Markets can behave unpredictably. Use your own judgment and risk management.
Скрипт с ограниченным доступом
Доступ к этому скрипту имеют только пользователи, одобренные автором. Вам необходимо запросить и получить разрешение на его использование. Обычно оно предоставляется после оплаты. Для получения подробной информации следуйте инструкциям автора ниже или свяжитесь напрямую с Daily-Crypto-Trading.
TradingView НЕ рекомендует оплачивать или использовать скрипт, если вы полностью не доверяете его автору и не понимаете, как он работает. Вы также можете найти бесплатные, открытые альтернативы в наших скриптах сообщества.
Инструкции от автора
Отказ от ответственности
Скрипт с ограниченным доступом
Доступ к этому скрипту имеют только пользователи, одобренные автором. Вам необходимо запросить и получить разрешение на его использование. Обычно оно предоставляется после оплаты. Для получения подробной информации следуйте инструкциям автора ниже или свяжитесь напрямую с Daily-Crypto-Trading.
TradingView НЕ рекомендует оплачивать или использовать скрипт, если вы полностью не доверяете его автору и не понимаете, как он работает. Вы также можете найти бесплатные, открытые альтернативы в наших скриптах сообщества.