OPEN-SOURCE SCRIPT
Обновлено Linear Regression Relative Strength

[image/x/iZvwDWEY/
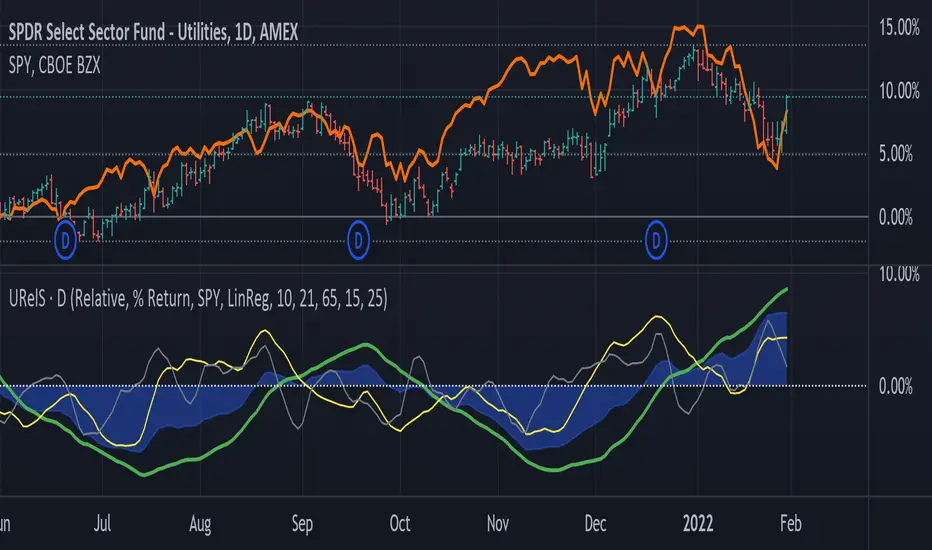
Relative Strength indicator comparing the current symbol to SPY (or any other benchmark). It may help to pick the right assets to complement the portfolio build around core ETFs such as SPY.
The general idea is to show if the current symbol outperforms or underperforms the benchmark (SPY by default) when bought some certain time ago. Relative performance is displayed as percent and is calculated for three different time ranges - short (1 mo by default), mid (1 quarter), and long (half a year). To smooth the volatility, the script uses linear regression to estimate the trend and takes the start and the end points of the linear regression line to compute the relative strength.
It is important to remember that the script shows the gain relative to SPY (or other selected benchmark), not the asset's gain. Therefore, it may indicate that the asset is profitable, but it still may lose value if SPY is in downtrend.
Therefore, it is crucial to check other indicators before making a decision. In the example above, standard linear regression for one quarter is used to indicate the direction of the trend.
Информация о релизе
Added source filtering options:- "None" - Relative Strength computed using the raw data: the current price and the price back in time.
- "3-point average" - an average of the three neighboring prices is used instead of the raw price.
- "5-point average" - an average of the five neighboring prices is used instead of the raw price.
- "Linear Regression Trend" - instead of the prices, linear regression trend is computed for the period and its first and last values are taken.
Comparison with baseline is now optional. You can turn it off in options and see how the asset alone performed.
Информация о релизе
Fixed bug in the calculation.New formula:
Gain = ( endPrice - startPrice ) / startPrice
RS = Gain( X ) - Gain( S&P )
The values are percent and they have clear economic sense. Given the period is P, RS is the profit which you would receive from buying the asset P days ago when compared to S&P (or other selected baseline).
Информация о релизе
- Added source selection, which is daily by default. It keeps the indicator values when switching to intraday.- 3 and 5 points average filters now use the weighted average, with wights 1-2-3 and 1-2-3-4-5 respectively. It reduces the delay of the filter to one and two bars.
- Changed the colors. Red is a short one, yellow is mid, and the blue area chart is long range.
- Changed the default periods so the red line is really close to MACD (and it can be used as MACD).
Информация о релизе
- Added Sharpe Ratio as another strength metric option- Various usability fixes
Скрипт с открытым кодом
В истинном духе TradingView, создатель этого скрипта сделал его открытым исходным кодом, чтобы трейдеры могли проверить и убедиться в его функциональности. Браво автору! Вы можете использовать его бесплатно, но помните, что перепубликация кода подчиняется нашим Правилам поведения.
Отказ от ответственности
Информация и публикации не предназначены для предоставления и не являются финансовыми, инвестиционными, торговыми или другими видами советов или рекомендаций, предоставленных или одобренных TradingView. Подробнее читайте в Условиях использования.