PROTECTED SOURCE SCRIPT
Scaled Price Deviation with Buffer

Advanced Scaled Price Deviation Indicator
This tool is for advanced technical analysis that goes beyond the typical deviation indicators. It incorporates dynamic scaling and a buffer mechanism to provide a more nuanced and adaptable assessment of price behavior relative to a moving average.
Core Functionality:
EMA and Deviation Calculation:
The indicator first calculates a 200-period Exponential Moving Average (EMA) of the closing price (ema200).
It then computes the absolute difference (priceDeviation) between the current closing price and the 200 EMA, essentially measuring the price's deviation from the moving average.
Dynamic Scaling and Buffering:
This is where the indicator becomes sophisticated. It employs a user-defined lookback period (lookbackPeriod) to analyze historical price deviations.
It dynamically calculates the maximum (maxDeviation) and minimum (minDeviation) deviations observed within the lookback window.
This allows the indicator to adjust its sensitivity based on recent market volatility.
A buffer multiplier (bufferMultiplier) further amplifies the dynamic upper limit, providing flexibility for traders with different risk tolerances.
Finally, the priceDeviation is recalibrated (scaledDeviation) to a range of 0 to 100, leveraging the dynamic min and max as reference points.
Capping and Plotting:
The scaledDeviation is capped to the dynamically calculated upper limit (dynamicUpperLimit), preventing extreme values during periods of high volatility.
Two plots are generated:
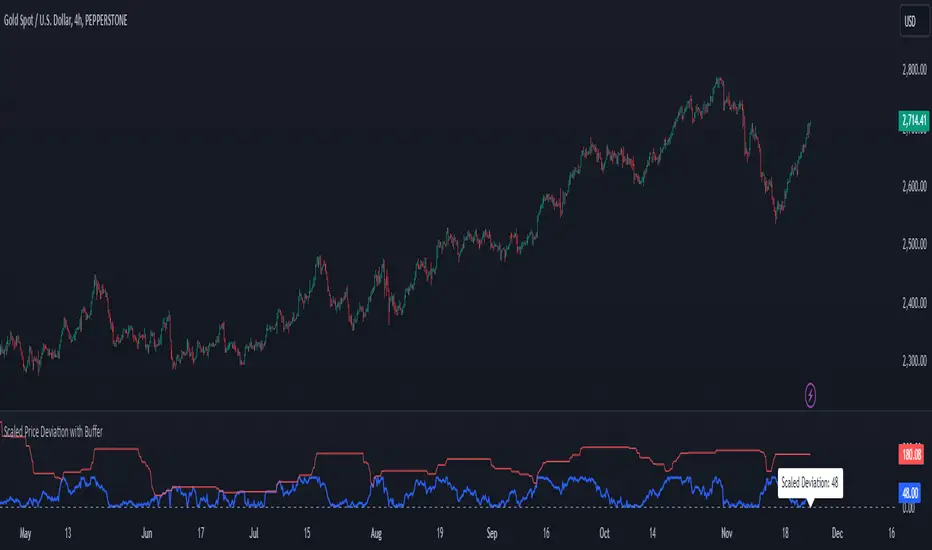
Scaled Price Deviation (blue line): This primary line depicts the scaled deviation, offering a normalized and visually intuitive representation of price behavior relative to the EMA.
Dynamic Upper Limit (red line): This line visualizes the dynamic threshold that caps the scaledDeviation, providing context for the indicator's range.
Reference and Information:
A horizontal line at zero serves as a visual benchmark for the scaledDeviation.
On the right side of the chart, a label dynamically displays the current value of the scaledDeviation, formatted with two decimal places for enhanced clarity.
Advanced Concepts:
This indicator offers a more context-aware analysis compared to traditional deviation indicators by dynamically scaling the price deviation based on recent volatility.
The buffer multiplier allows for customization of the indicator's sensitivity to extreme price movements.
The capped scaledDeviation provides a more manageable interpretation during volatile periods.
Applications:
This indicator can be used for various trading strategies, including:
Identifying potential overbought and oversold conditions based on the scaledDeviation's position relative to zero and the dynamic upper limit.
Gauging price momentum or potential trend changes by analyzing the slope of the scaledDeviation line.
Disclaimer:
This indicator is provided as-is; and is intended for educational and informational purposes only. It does not constitute financial advice. Users are solely responsible for their own investment decisions and should conduct thorough research and consult with professionals as errors are prompt to happen.
Скрипт с защищённым кодом
Этот скрипт опубликован с закрытым исходным кодом. Однако вы можете использовать его свободно и без каких-либо ограничений — читайте подробнее здесь.
Отказ от ответственности
Информация и публикации не предназначены для предоставления и не являются финансовыми, инвестиционными, торговыми или другими видами советов или рекомендаций, предоставленных или одобренных TradingView. Подробнее читайте в Условиях использования.