PROTECTED SOURCE SCRIPT
Обновлено CVDD + Terminal Price Indicator + Z-SCORE
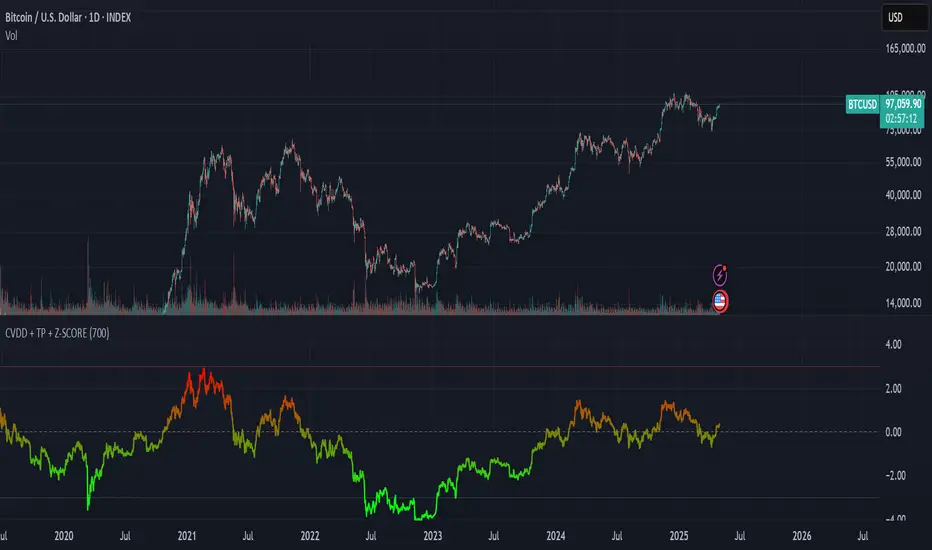
This custom indicator is designed to help identify major overvaluation and undervaluation zones in Bitcoin's market cycles by analyzing price behavior relative to long-term on-chain benchmarks.
It leverages two well-known valuation models — CVDD (Cumulative Value Days Destroyed) and Terminal Price — to define a dynamic valuation range that adapts over time. These reference points are combined with a custom Z-score framework to evaluate how extended price is compared to long-term value zones.
The result is a normalized oscillator that highlights extremes in market sentiment, ranging from –3 (potential deep value) to +3 (potential overheated conditions), with a gradient color scale for quick visual interpretation.
This tool is especially useful for long-term investors and macro analysts seeking signals of potential market tops and bottoms based on deep on-chain behavior — rather than short-term technicals.
Информация о релизе
This custom indicator is designed to help identify major overvaluation and undervaluation zones in Bitcoin's market cycles by analyzing price behavior relative to long-term on-chain benchmarks.It leverages two well-known valuation models — CVDD (Cumulative Value Days Destroyed) and Terminal Price — to define a dynamic valuation range that adapts over time. These reference points are combined with a custom Z-score framework to evaluate how extended price is compared to long-term value zones.
The result is a normalized oscillator that highlights extremes in market sentiment, ranging from –3 (potential deep value) to +3 (potential overheated conditions), with a gradient color scale for quick visual interpretation.
This tool is especially useful for long-term investors and macro analysts seeking signals of potential market tops and bottoms based on deep on-chain behavior — rather than short-term technicals.
Скрипт с защищённым кодом
Этот скрипт опубликован с закрытым исходным кодом. Однако вы можете использовать его свободно и без каких-либо ограничений — читайте подробнее здесь.
Отказ от ответственности
Информация и публикации не предназначены для предоставления и не являются финансовыми, инвестиционными, торговыми или другими видами советов или рекомендаций, предоставленных или одобренных TradingView. Подробнее читайте в Условиях использования.