OPEN-SOURCE SCRIPT
Обновлено The Adam Khoo Magic
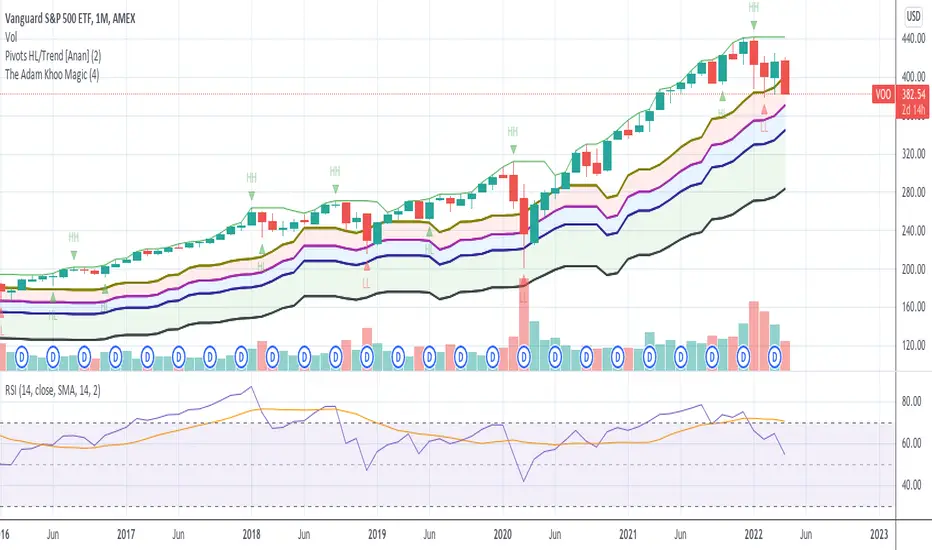
Totally inspired by Adam Khoo's analogy
This is meant for the monthly bar:
Where you try to find the highest point of the average recession/correction time to the bottom:
average correction time to bottom: 4.2months
average bear market time to bottom: 13months (default)
Plot/Fill chart with the 4 tranches recommended:
-8%, -15%, -21% and -35% to gauge entry point
Информация о релизе
Changed that hardcoded timeframe to follow the dynamic highlengthСкрипт с открытым кодом
В истинном духе TradingView, создатель этого скрипта сделал его открытым исходным кодом, чтобы трейдеры могли проверить и убедиться в его функциональности. Браво автору! Вы можете использовать его бесплатно, но помните, что перепубликация кода подчиняется нашим Правилам поведения.
Отказ от ответственности
Информация и публикации не предназначены для предоставления и не являются финансовыми, инвестиционными, торговыми или другими видами советов или рекомендаций, предоставленных или одобренных TradingView. Подробнее читайте в Условиях использования.
Скрипт с открытым кодом
В истинном духе TradingView, создатель этого скрипта сделал его открытым исходным кодом, чтобы трейдеры могли проверить и убедиться в его функциональности. Браво автору! Вы можете использовать его бесплатно, но помните, что перепубликация кода подчиняется нашим Правилам поведения.
Отказ от ответственности
Информация и публикации не предназначены для предоставления и не являются финансовыми, инвестиционными, торговыми или другими видами советов или рекомендаций, предоставленных или одобренных TradingView. Подробнее читайте в Условиях использования.