OPEN-SOURCE SCRIPT
Double EMA & SMA
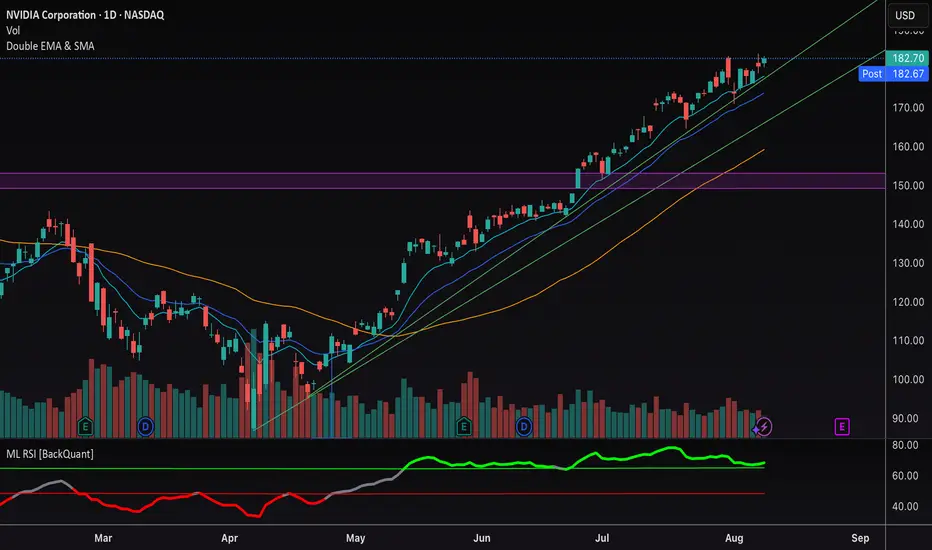
This indicator plots two Exponential Moving Averages (EMAs) and one Simple Moving Average (SMA) directly on the price chart to help identify market trends and momentum shifts.
By default, it displays:
• EMA 1 (10-period) – short-term trend
• EMA 2 (20-period) – medium-term trend
• SMA (50-period) – broader trend baseline
The combination allows traders to quickly spot trend direction, potential reversal points, and areas of dynamic support or resistance. Suitable for scalping, swing trading, and longer-term analysis across any market.
Скрипт с открытым кодом
В истинном духе TradingView, создатель этого скрипта сделал его открытым исходным кодом, чтобы трейдеры могли проверить и убедиться в его функциональности. Браво автору! Вы можете использовать его бесплатно, но помните, что перепубликация кода подчиняется нашим Правилам поведения.
Отказ от ответственности
Информация и публикации не предназначены для предоставления и не являются финансовыми, инвестиционными, торговыми или другими видами советов или рекомендаций, предоставленных или одобренных TradingView. Подробнее читайте в Условиях использования.