OPEN-SOURCE SCRIPT
Options Volume Indicator
Обновлено
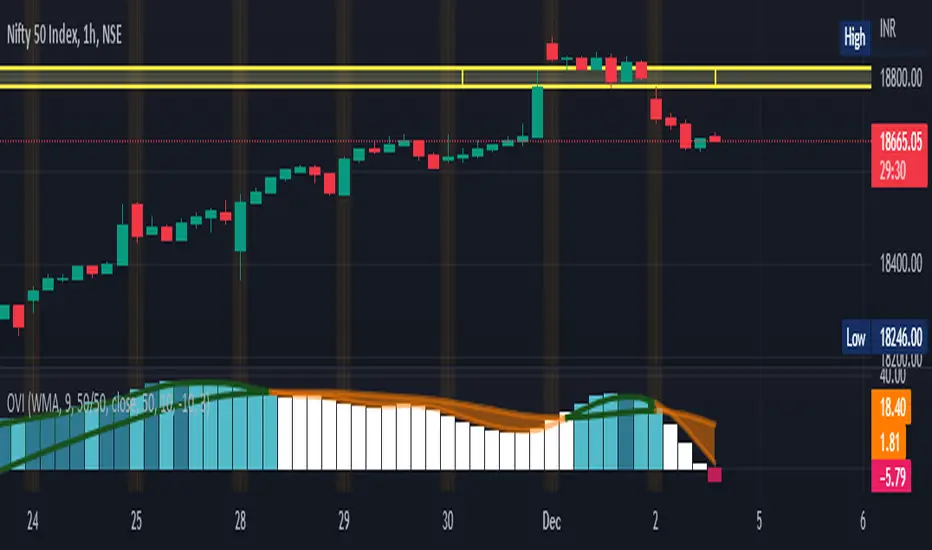
- Volume Indicator for Option Trading, it is a simple indicator based on Relative Strength Index. There are two horizontal lines are mention 10 and -10, if bar crossed above the (Line 10) then go for buy and when Bar cross under (Line -10) go for sell side.
- If Bar Color changed to Respective color of the previous bar i.e. color gets darker then you can exit/ trail SL there because it overbought / Oversold position and vice versa for Sell Side.
- this volume indicator works on any Script.
- The Black Floating Line indicates the Average volume
Информация о релизе
Strategy Tester AddedUpdate Chart
Информация о релизе
- The Average RSI Line now more colorful
- Always wait for to change the line from red to green for more confirmation
- Some minor color changes , three zone specially if RSI crosses above 85 or 15 the Volume candle gets Purple it will shows the RSI is extreme Zone you can exit or wait for newer entry
Информация о релизе
- Minor changes in zones i.e. 90 and 10 are extreme overbought zones
Информация о релизе
- minor change
Информация о релизе
- Smoothing Methods added i.e. HMA & RSI
Информация о релизе
- RSI Smoothing Method Changes
- Easy to Navigate the RSI zone in quick manner
Информация о релизе
- Change in trend / volume shows on indicator by shape Diamond with its respective colors green for Long side and red for Put side.
Информация о релизе
- Trend Reversal Indication on Volume chart with black Dimond signal.
Информация о релизе
- Automatically Set Extreme zones as per the RSI zones
Информация о релизе
- Smoothing Method Added i.e. RMA
Информация о релизе
- Added independent Volume for Banknifty to check the average volume of Banknifty Index it acts a regime filter for RSI. for other indexes uncheck the banknifty option from setting pannel.
Информация о релизе
- Reversed the changes, take longer time to load while trading.
Информация о релизе
- Minor changes in code to improve performance
Информация о релизе
- More accurately Reversal Signal Can Work
Информация о релизе
- Smoothing Bug Fixed
Информация о релизе
- Minor Changes
Информация о релизе
Now you can change the Smoothing Period as well as the some minor changesИнформация о релизе
ALMA Confirmation addedИнформация о релизе
Trend Cloud added help you to understand the trend direction such green represents the Buyers and Red represents the Sellers.Hope you like it
Regards,
Mayur Supe
Информация о релизе
Small Timeframe changesИнформация о релизе
bug fixedИнформация о релизе
Now you will Detect the High Volume candle on indicatorИнформация о релизе
The code completely changedThe volume threshold based volume added
reversal dot are draws according to bull and bear color
Hope you like this
Информация о релизе
minor bug fixedСкрипт с открытым кодом
В истинном духе TradingView автор этого скрипта опубликовал его с открытым исходным кодом, чтобы трейдеры могли понять, как он работает, и проверить на практике. Вы можете воспользоваться им бесплатно, но повторное использование этого кода в публикации регулируется Правилами поведения. Вы можете добавить этот скрипт в избранное и использовать его на графике.
Отказ от ответственности
Все виды контента, которые вы можете увидеть на TradingView, не являются финансовыми, инвестиционными, торговыми или любыми другими рекомендациями. Мы не предоставляем советы по покупке и продаже активов. Подробнее — в Условиях использования TradingView.