PROTECTED SOURCE SCRIPT
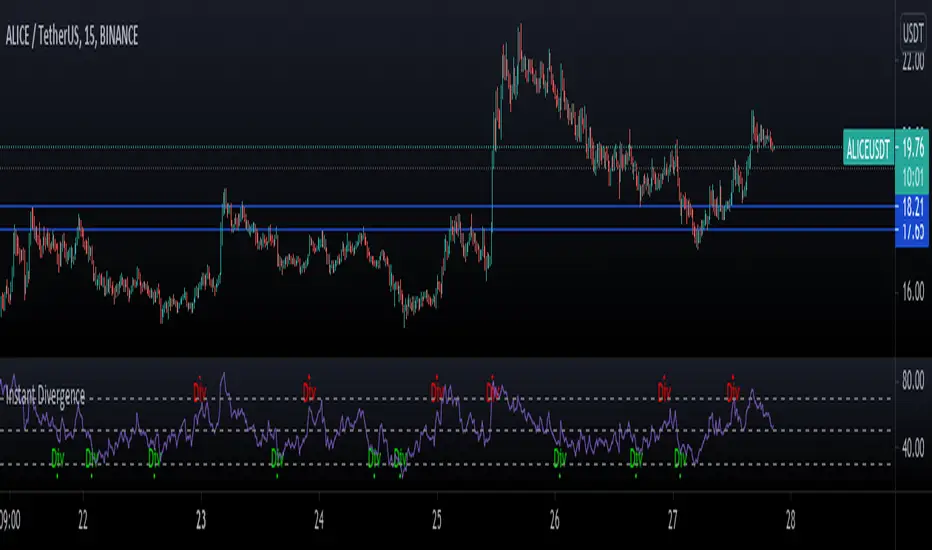
Instant RSI Divergence

This script uses RSI Highs and Lows along with measuring price actions Highs and lows to find Divergences instantly.
The common problem when doing this is that you end up with signals all over the place if you dont use the pivot finder as confirmation however I have found a way to avoid this problem.
Since there extra bars to confirm whether price are making pivot highs or not, you can end up with some signals which are invalidated a few bars later.
The Green Divs are showing Bullish divergence and the Red Divs are showing bearish divergence.
You can use this with other indicators to mark up more levels of confluence to confirm trade entries.
Скрипт с защищённым кодом
Этот скрипт опубликован с закрытым исходным кодом. Однако вы можете использовать его свободно и без каких-либо ограничений — читайте подробнее здесь.
Отказ от ответственности
Информация и публикации не предназначены для предоставления и не являются финансовыми, инвестиционными, торговыми или другими видами советов или рекомендаций, предоставленных или одобренных TradingView. Подробнее читайте в Условиях использования.