OPEN-SOURCE SCRIPT
Обновлено Big 7 NASDAQ
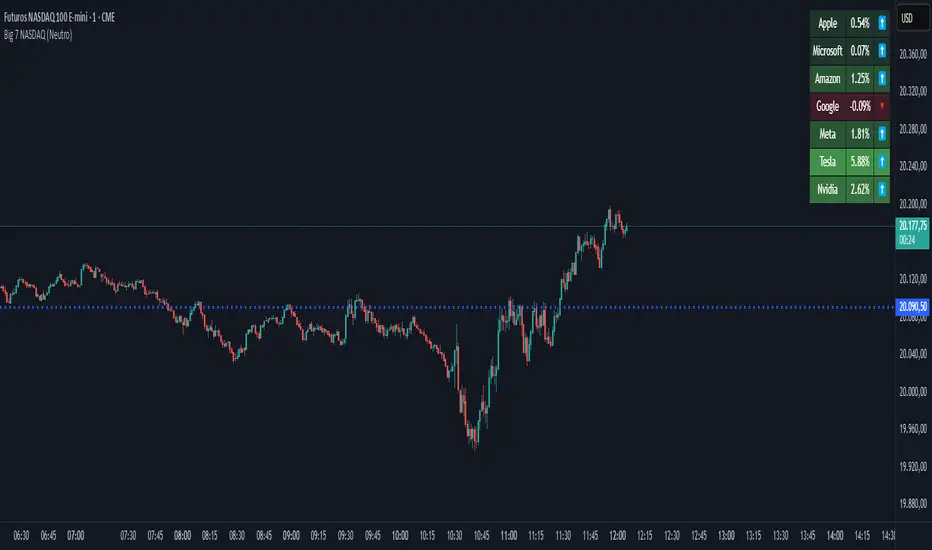
📊 Big 7 NASDAQ % Change Heatmap with Trend Arrows
This indicator displays a real-time performance table for the "Big 7" NASDAQ stocks:
Apple (AAPL), Microsoft (MSFT), Amazon (AMZN), Google (GOOGL), Meta (META), Tesla (TSLA), and Nvidia (NVDA).
🔎 Features:
Live Daily % Change: Calculates the percentage change between today’s open and the current price.
Color Gradient: Background color intensity reflects the strength of the move (from mild to strong bullish/bearish).
Trend Arrows: Visual arrows 🔺 (up) and 🔻 (down) represent the direction of movement.
Position Mode Selector:
"Buy" – highlights with green tones
"Sell" – highlights with red tones
"Neutral" – uses dynamic coloring based on individual stock moves
📍 Placement:
The table is positioned in the top-right corner of the chart for easy reference without cluttering your main view.
Информация о релизе
✅ Update: Position Context Mode & Dynamic HighlightingThis update introduces a new "Position Type" selector, allowing traders to switch between Buy, Sell, and Neutral modes.
In Buy mode, bullish assets are highlighted with shades of green based on strength.
In Sell mode, bearish assets are emphasized using red gradients.
In Neutral mode, each stock is independently colored based on its own % change.
This enhancement provides a clearer visual focus aligned with your current market bias or trading strategy.
Скрипт с открытым кодом
В истинном духе TradingView, создатель этого скрипта сделал его открытым исходным кодом, чтобы трейдеры могли проверить и убедиться в его функциональности. Браво автору! Вы можете использовать его бесплатно, но помните, что перепубликация кода подчиняется нашим Правилам поведения.
Отказ от ответственности
Информация и публикации не предназначены для предоставления и не являются финансовыми, инвестиционными, торговыми или другими видами советов или рекомендаций, предоставленных или одобренных TradingView. Подробнее читайте в Условиях использования.