PROTECTED SOURCE SCRIPT
9, 21, 50 EMA TN
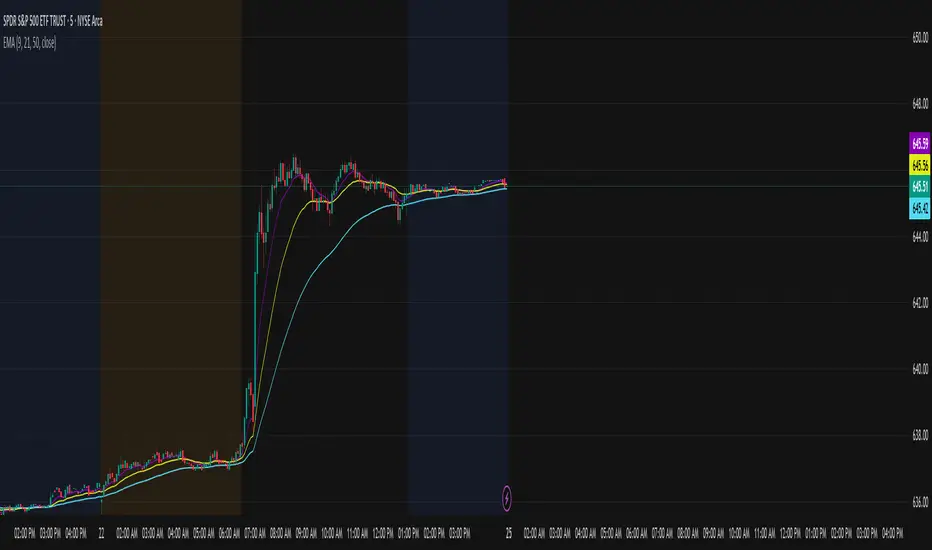
This indicator plots three exponential moving averages (EMAs) on the chart:
9 EMA (purple) – short-term trend and momentum
21 EMA (yellow) – medium-term trend
50 EMA (cyan) – long-term trend and overall market direction
How it’s used:
Traders look for the 9 EMA to cross above the 21 EMA as a potential bullish signal. This suggests upward momentum and may be used as confirmation for call entries.
Conversely, when the 9 EMA crosses below the 21 EMA, it can indicate bearish momentum, often used as confirmation for put entries.
The 50 EMA acts as a higher timeframe filter: when price and the shorter EMAs are above the 50 EMA, it confirms bullish bias; when they’re below, it confirms bearish bias.
This tool helps identify short-term momentum shifts while staying aligned with the larger market trend.
Скрипт с защищённым кодом
Этот скрипт опубликован с закрытым исходным кодом. Однако вы можете использовать его свободно и без каких-либо ограничений — читайте подробнее здесь.
Отказ от ответственности
Информация и публикации не предназначены для предоставления и не являются финансовыми, инвестиционными, торговыми или другими видами советов или рекомендаций, предоставленных или одобренных TradingView. Подробнее читайте в Условиях использования.