EMA based Candle Coloring
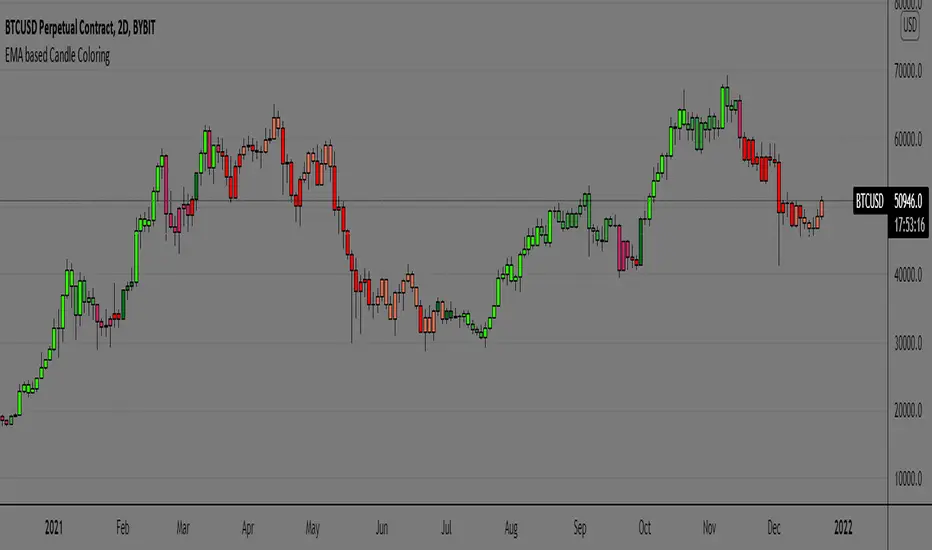
In this script plain EMA or MA is not used for candle coloring, but it takes multiple EMAs of the original EMA and then subtracts lag from the result to get data points of each candle of two certain periods defined. As it differs from traditional EMAs and MAs by reacting quicker to price changes and is able to subtract lag with its calculated formula.
The candle coloring is able to interpret short-term price direction and overall trend and its suitable for active traders. As it tracks price more closely than SMAs
Since EMAs can also provide support or resistance for price and is highly reliant on the asset’s lookback period we can make sure we stay with the trend rather than going against the trend.
*First of all here's what the colors represent and how to interpret them is shown in below image
Examples of how I use the Coloring pattern
Spotting a fakeout/stophunt
during trends:
* No strategy is 100% accurate this script is one of those too , traders must use this as an addition to their system rather than making it a standalone system.
* Context is important as the coloring is done using calculations, different timeframes has different context hence traders discretion is key.
Hope you find this helpful,
Thankyou.
happy trading.
Скрипт с ограниченным доступом
Только пользователи, одобренные автором, могут получить доступ к этому скрипту. Вам нужно отправить запрос и получить разрешение на его использование. Обычно доступ предоставляется после оплаты. Для получения подробной информации следуйте инструкциям автора ниже или свяжитесь с buckham_ напрямую.
TradingView НЕ рекомендует платить за скрипт или использовать его, если вы не доверяете его автору и не понимаете, как скрипт работает. Вы всегда можете найти бесплатные скрипты с открытым исходным кодом в Скриптах сообщества.
Инструкции от автора
Отказ от ответственности
Скрипт с ограниченным доступом
Только пользователи, одобренные автором, могут получить доступ к этому скрипту. Вам нужно отправить запрос и получить разрешение на его использование. Обычно доступ предоставляется после оплаты. Для получения подробной информации следуйте инструкциям автора ниже или свяжитесь с buckham_ напрямую.
TradingView НЕ рекомендует платить за скрипт или использовать его, если вы не доверяете его автору и не понимаете, как скрипт работает. Вы всегда можете найти бесплатные скрипты с открытым исходным кодом в Скриптах сообщества.