OPEN-SOURCE SCRIPT
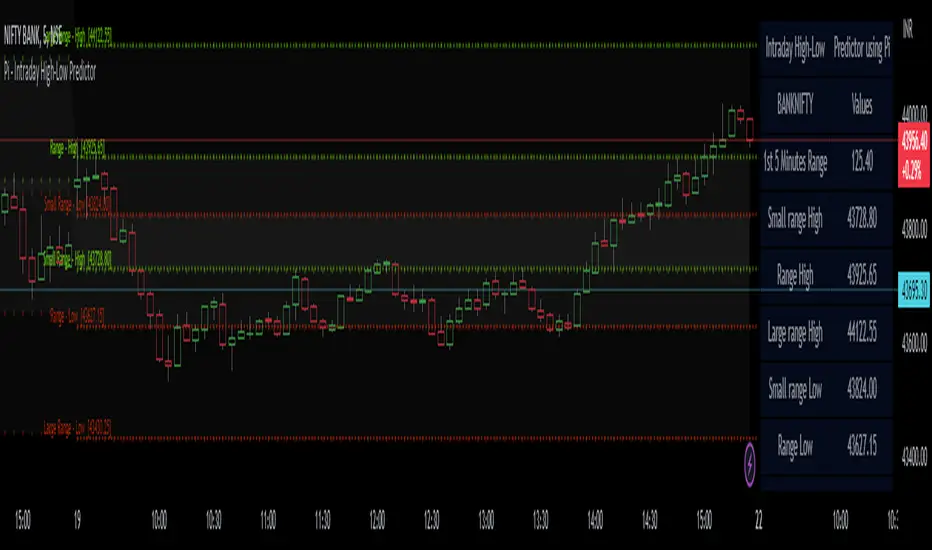
Pi - Intraday High-Low Predictor

Pi - Intraday High-Low Predictor
This is not my Strategy/Research , I've just coded it into a indicator.
I found it interesting & useful so I'm sharing it here.
This Strategy/Research is by Kshirod Chandra Mohanty ( y-o-u-t-u-b-e : Trade with IITIAN )
You can watch his video on y-o-u-t-u-b-e for more info on this one.
the video has following title :
"1Cr Paid Strategy For Free || 10000 Subscribers Special Giveaway || How to find Day High or Low"
This will not tell you which is day high or day low, but it will help you to predict the day high from a day low and day low from a day high.
It will give you a possible range to which the prices could move to.
He has explained/used this on Banknifty.
How to Find out Day High from Day Low & Day Low from Day High :-
He uses the value of Pi (3.14) and the Range of 1st 5minute candle to find out the possible highs from day low and the possible lows from day high.
Range = value of Pi * 1st 5minutes Range
Small range = Range / 2
Large range = Range + Small range
so to find out the possible lows from day high we do following calculations
Small range low = day high - Small range
Range low = day high - Range
Large range low = day high - Large range
and to find out the possible highs from day low we do following calculations
Small range high = day low + Small range
Range high = day low + Range
Large range high = day low + Large range
Note :- This Indicator does Repaint in following ways,
As the script uses the Day High to predict the possible lows ,
so if it's an up-trending day and price keeps on making new High's then the ranges for lows will keep on changing.
similarly the script uses the Day Low to predict the possible high's ,
so if it's an down-trending day and price keeps on making new Low's then the ranges for highs will keep on changing.
My observations / thoughts about this :-
This script does not provide buy/sell recommendations. it just provides possible ranges to where prices can go from Day-High & Day-Low.
It's better to avoid trading when the price is trading between the Small range high & Small range low levels.
As it has high probability that it will be a range bound day and price will stay in between those two levels.
There is a high probability that it will be a trending day if price breaks either the Small range high/low ,
then the price could move to Range low/high.
If price breaks from Range High/Low then there is a high probability that it will be a trending day and the price could move to Large Range low/high.
Note :- If you want to use this on instruments/scripts/indexes which are active for large session such as forex/cryptos , then i suggest that you use the Opening Range period of 4Hours i.e 240minutes, to get better results.
using the default setting of 5minutes will not give good results on them.
play around with this value to find out which one suits that instrument/script/index the best.
Don't trust these levels blindly, do backtest or live testing of this then use for real trade if you want.
Use Price action near these levels to make any trading decision's.
The script provides following options :
1. Option to display Ranges in a Table (which you can enable/hide as you wish)
You can set the Table's location, size , background color & text color according to your preference.
2. Option to enable/hide Predicted-Highs from Day-Low on chart.
3. Option to enable/hide Predicted-Lows from Day-High on chart.
4. Option to set the Opening range period - here you can select your preferred opening range for calculation purpose.
5. Option to enable/hide historical levels on chart.
6. Options to customize the colors & line styles for lines.
7. Options to customize the colors , position & size for labels.
Скрипт с открытым кодом
В истинном духе TradingView, создатель этого скрипта сделал его открытым исходным кодом, чтобы трейдеры могли проверить и убедиться в его функциональности. Браво автору! Вы можете использовать его бесплатно, но помните, что перепубликация кода подчиняется нашим Правилам поведения.
Отказ от ответственности
Информация и публикации не предназначены для предоставления и не являются финансовыми, инвестиционными, торговыми или другими видами советов или рекомендаций, предоставленных или одобренных TradingView. Подробнее читайте в Условиях использования.