OPEN-SOURCE SCRIPT
ShadowStats vs Official CPI YoY%
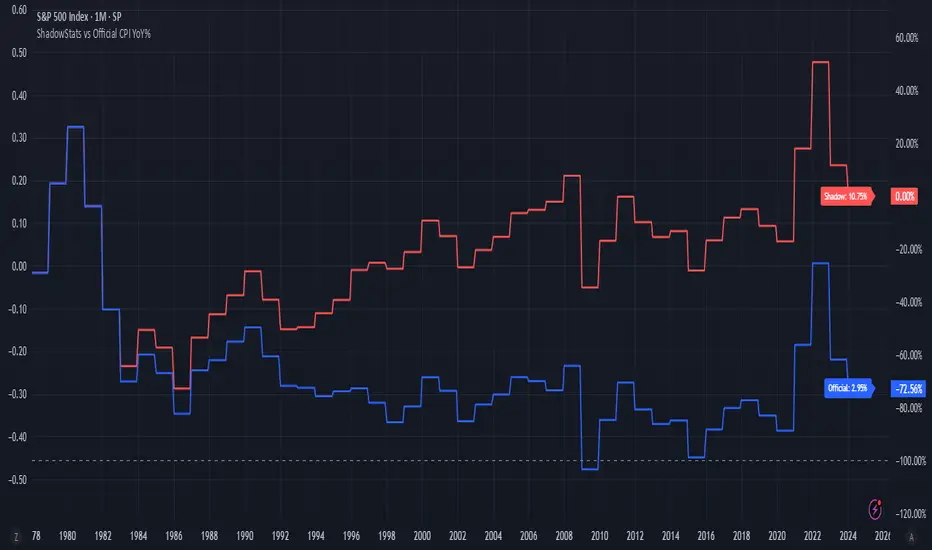
This chart visualizes and compares the year-over-year (YoY) percentage change in the Consumer Price Index (CPI) as calculated by the U.S. government versus the alternative methodology used by ShadowStats, which reflects pre-1980 inflation measurement techniques. The red line represents ShadowStats' CPI YoY% estimates, while the blue line shows the official CPI YoY% reported by government sources. This side-by-side view highlights the divergence in reported inflation rates over time, particularly from the 1980s onward, offering a visual representation of how different calculation methods can lead to vastly different interpretations of inflation and purchasing power loss.
Скрипт с открытым кодом
В истинном духе TradingView, создатель этого скрипта сделал его открытым исходным кодом, чтобы трейдеры могли проверить и убедиться в его функциональности. Браво автору! Вы можете использовать его бесплатно, но помните, что перепубликация кода подчиняется нашим Правилам поведения.
Отказ от ответственности
Информация и публикации не предназначены для предоставления и не являются финансовыми, инвестиционными, торговыми или другими видами советов или рекомендаций, предоставленных или одобренных TradingView. Подробнее читайте в Условиях использования.