PROTECTED SOURCE SCRIPT
Обновлено Nq/ES daily CME risk interval
NQ/ES Daily CME Range Indicator: Description and Usage
What the Indicator Does
Reverse engineering the risk interval for CME (Chicago Mercantile Exchange) products based on margin requirements involves understanding the relationship between margin requirements, volatility, and the risk interval (price movement assumed for margin calculation)
The CME uses a methodology called SPAN (Standard Portfolio Analysis of Risk) to calculate margins. At a high level, the initial margin is derived from:
Initial Margin = Risk Interval × Contract Size × Volatility Adjustment Factor
This indicator creates daily risk intervals for NQ/ES futures contracts based on volatility measurements given the fact that the CME volatility adjustment factor is not public.
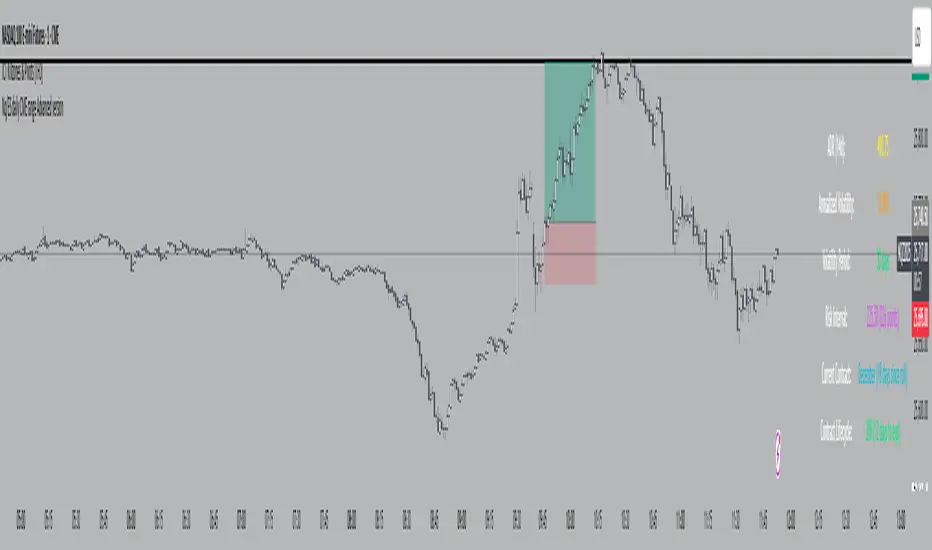
The indicator draws horizontal lines on your chart that represent expected price movement ranges based on:
Your specified maintenance margin requirements
Current and historical volatility calculations
Contract lifecycle and rollover detection
The indicator automatically detects when futures contracts roll over to a new contract month, dynamically adjusts volatility calculations throughout the contract lifecycle, and displays the intervals as horizontal lines that extend from the previous day's close. These intervals give you a visual representation of likely price ranges for the current trading session.
How to Use the Indicator
To use this indicator effectively:
Add it to your NQ or ES futures chart (works on continuous contracts or individual contract months)
Set your maintenance margin amount in the risk interval settings (product margins page from the CME website. I tend to use the maintenance short margin)
The indicator will automatically draw horizontal lines at 18:00 ET each day
Use these lines as potential profit targets in volatile days
Monitor the information table for details on volatility, risk interval size, and contract lifecycle
The indicator helps you visualize expected price movement based on market volatility and your specified risk parameters, allowing you to make more informed trading decisions about position sizing and potential profit targets.
Additionally, when the market moves on news/events you will notice it will most often move exactly the risk interval value.
Why These Settings Work as Defaults
First Month Vol Period (30): The first 30 days after contract rollover typically have different volatility characteristics. This setting ensures accurate volatility measurements during this period when contract behaviour may be less stable.
Enable Volatility Floor (Checked): This prevents volatility from falling below historical levels, ensuring your risk intervals don't become too narrow during artificially calm periods. Research shows that protracted low volatility can lead to a build-up of leverage and risk, making the system vulnerable.
Volatility Floor % (0.7): The 0.7 setting works better than higher values because it better accounts for how equity volatility behaves at lower bounds. It allows for natural mean reversion while still providing protection against underestimating risk during low volatility periods.
Transition Period (30 days): This creates a smooth transition from the first month volatility period to the actual days since rollover calculation, preventing abrupt changes in your risk intervals.
Annual Trading Days (252): 252 is the standard number of trading days in a year used in financial calculations. This value is used for properly annualizing volatility measurements.
Long-Term Volatility Period (504): A 504-day period (approximately 2 years of trading days) provides several advantages over the standard 252-day setting. It better captures full market cycles including both bull and bear markets, provides more stable volatility estimates across regime changes, and results in more reliable risk intervals. Research shows this longer timeframe produces better volatility forecasts for futures markets, as it captures a more comprehensive range of market conditions while smoothing out anomalous periods.
The combination of these settings—particularly the 504-day long-term period with the 0.7 volatility floor—creates more stable and reliable risk intervals that adapt appropriately to changing market conditions without becoming overly sensitive to short-term fluctuations or too sluggish during genuine market shifts.
What the Indicator Does
Reverse engineering the risk interval for CME (Chicago Mercantile Exchange) products based on margin requirements involves understanding the relationship between margin requirements, volatility, and the risk interval (price movement assumed for margin calculation)
The CME uses a methodology called SPAN (Standard Portfolio Analysis of Risk) to calculate margins. At a high level, the initial margin is derived from:
Initial Margin = Risk Interval × Contract Size × Volatility Adjustment Factor
This indicator creates daily risk intervals for NQ/ES futures contracts based on volatility measurements given the fact that the CME volatility adjustment factor is not public.
The indicator draws horizontal lines on your chart that represent expected price movement ranges based on:
Your specified maintenance margin requirements
Current and historical volatility calculations
Contract lifecycle and rollover detection
The indicator automatically detects when futures contracts roll over to a new contract month, dynamically adjusts volatility calculations throughout the contract lifecycle, and displays the intervals as horizontal lines that extend from the previous day's close. These intervals give you a visual representation of likely price ranges for the current trading session.
How to Use the Indicator
To use this indicator effectively:
Add it to your NQ or ES futures chart (works on continuous contracts or individual contract months)
Set your maintenance margin amount in the risk interval settings (product margins page from the CME website. I tend to use the maintenance short margin)
The indicator will automatically draw horizontal lines at 18:00 ET each day
Use these lines as potential profit targets in volatile days
Monitor the information table for details on volatility, risk interval size, and contract lifecycle
The indicator helps you visualize expected price movement based on market volatility and your specified risk parameters, allowing you to make more informed trading decisions about position sizing and potential profit targets.
Additionally, when the market moves on news/events you will notice it will most often move exactly the risk interval value.
Why These Settings Work as Defaults
First Month Vol Period (30): The first 30 days after contract rollover typically have different volatility characteristics. This setting ensures accurate volatility measurements during this period when contract behaviour may be less stable.
Enable Volatility Floor (Checked): This prevents volatility from falling below historical levels, ensuring your risk intervals don't become too narrow during artificially calm periods. Research shows that protracted low volatility can lead to a build-up of leverage and risk, making the system vulnerable.
Volatility Floor % (0.7): The 0.7 setting works better than higher values because it better accounts for how equity volatility behaves at lower bounds. It allows for natural mean reversion while still providing protection against underestimating risk during low volatility periods.
Transition Period (30 days): This creates a smooth transition from the first month volatility period to the actual days since rollover calculation, preventing abrupt changes in your risk intervals.
Annual Trading Days (252): 252 is the standard number of trading days in a year used in financial calculations. This value is used for properly annualizing volatility measurements.
Long-Term Volatility Period (504): A 504-day period (approximately 2 years of trading days) provides several advantages over the standard 252-day setting. It better captures full market cycles including both bull and bear markets, provides more stable volatility estimates across regime changes, and results in more reliable risk intervals. Research shows this longer timeframe produces better volatility forecasts for futures markets, as it captures a more comprehensive range of market conditions while smoothing out anomalous periods.
The combination of these settings—particularly the 504-day long-term period with the 0.7 volatility floor—creates more stable and reliable risk intervals that adapt appropriately to changing market conditions without becoming overly sensitive to short-term fluctuations or too sluggish during genuine market shifts.
Информация о релизе
Name change to clear confusion vs previous scriptИнформация о релизе
name updateСкрипт с защищённым кодом
Этот скрипт опубликован с закрытым исходным кодом. Однако вы можете использовать его свободно и без каких-либо ограничений — читайте подробнее здесь.
Отказ от ответственности
Информация и публикации не предназначены для предоставления и не являются финансовыми, инвестиционными, торговыми или другими видами советов или рекомендаций, предоставленных или одобренных TradingView. Подробнее читайте в Условиях использования.
Скрипт с защищённым кодом
Этот скрипт опубликован с закрытым исходным кодом. Однако вы можете использовать его свободно и без каких-либо ограничений — читайте подробнее здесь.
Отказ от ответственности
Информация и публикации не предназначены для предоставления и не являются финансовыми, инвестиционными, торговыми или другими видами советов или рекомендаций, предоставленных или одобренных TradingView. Подробнее читайте в Условиях использования.