OPEN-SOURCE SCRIPT
Обновлено Logarithmic Volume
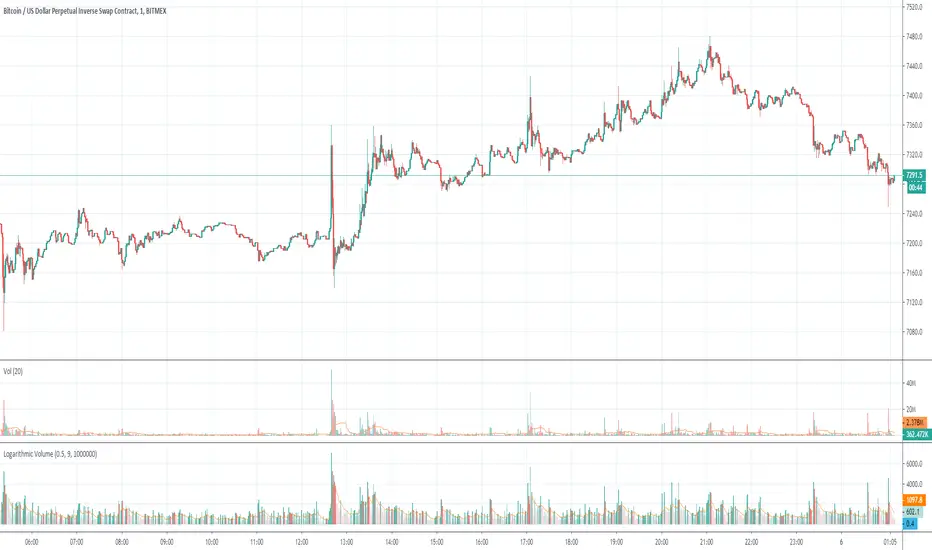
In volatile markets, normal indicator suffer from volume spikes that make the rest of plot seem non-existent.
Using logarithmic exponent, this indicator normalizes the volume, so this makes it easier to read.
The obvious drawback is that it does not display the actual volume amount, only a relative value.
Using logarithmic exponent, this indicator normalizes the volume, so this makes it easier to read.
The obvious drawback is that it does not display the actual volume amount, only a relative value.
Информация о релизе
Included the original volume indicator in the screenshot so you can see the difference.Информация о релизе
Fixed incorrect bar colors, note: it's actually intended to be green on rising volume and red on declining volume.Информация о релизе
I found the way to include the original volume data on the chart!The actual volume is being divided by a large number, so it doesn't break the chart.
The outcome value is small and transparent, yet it's still printed on the chart.
In this example it is divided by 1000000 or one million bitmex contracts.
Скрипт с открытым кодом
В истинном духе TradingView, создатель этого скрипта сделал его открытым исходным кодом, чтобы трейдеры могли проверить и убедиться в его функциональности. Браво автору! Вы можете использовать его бесплатно, но помните, что перепубликация кода подчиняется нашим Правилам поведения.
Отказ от ответственности
Информация и публикации не предназначены для предоставления и не являются финансовыми, инвестиционными, торговыми или другими видами советов или рекомендаций, предоставленных или одобренных TradingView. Подробнее читайте в Условиях использования.