PROTECTED SOURCE SCRIPT
KIMATIX LITE Absorption
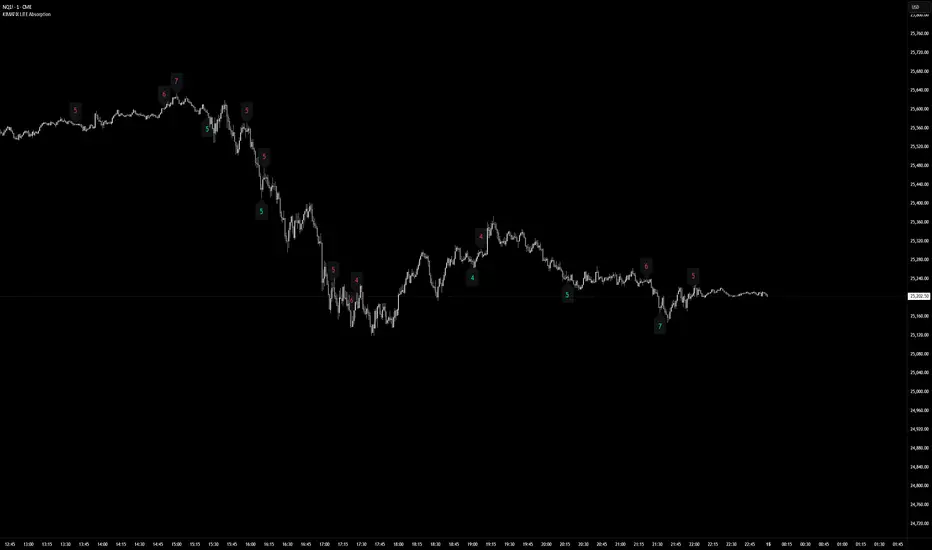
This indicator highlights absorption intensity directly on the chart using numeric sigma values only.
It is a deliberately reduced, signal-agnostic visualization designed to expose where significant absorption occurs, without adding levels, lines, or trade logic.
What you see
Numeric sigma values on candles
Each number represents the strength of absorption measured in standard deviations (σ).
Color-coded context
Green numbers below price → sell-side absorption
Red numbers above price → buy-side absorption
Only values that exceed the Minimum Sigma threshold are displayed.
No lines, zones, triangles, or alerts are shown — only the raw absorption magnitude.
How it works (LITE Version)
Absorption is derived from volume relative to candle structure
Values are normalized and filtered using:
A fixed statistical lookback
Wick dominance rules to avoid noise
Only statistically significant events (σ ≥ threshold) are visualized
All other calculations run silently in the background.
Intended use
This Lite version is meant to:
Identify areas of aggressive participation or defense
Spot potential absorption during trends or ranges
Provide context for liquidity, exhaustion, or hidden interest
It is not a trading system and does not generate entries or exits.
Use it as a contextual layer alongside your own execution logic.
The full version is distributed separately.
More information can be found here:
whop.com/kimatixtrading
Скрипт с защищённым кодом
Этот скрипт опубликован с закрытым исходным кодом. Однако вы можете использовать его свободно и без каких-либо ограничений — читайте подробнее здесь.
KIMATIX Trading
Отказ от ответственности
Информация и публикации не предназначены для предоставления и не являются финансовыми, инвестиционными, торговыми или другими видами советов или рекомендаций, предоставленных или одобренных TradingView. Подробнее читайте в Условиях использования.