OPEN-SOURCE SCRIPT
EMA Channel Key K-Lines
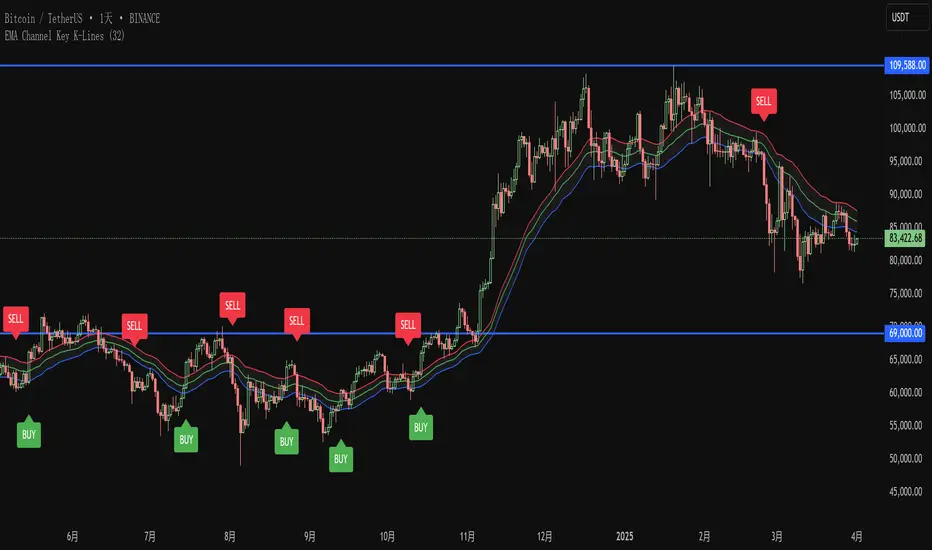
EMA Channel Setup:
Key K-line Identification:
Visual Markers:
Logic Flow:
- Three 32-period EMAs (high, low, close prices)
- Visually distinct colors (red, blue, green)
- Gray background between high and low EMAs
Key K-line Identification:
- For buy signals: Close > highest EMA, K-line height ≥ channel height, body ≥ 2/3 of range
- For sell signals: Close < lowest EMA, K-line height ≥ channel height, body ≥ 2/3 of range
- Alternating signals only (no consecutive buy/sell signals)
Visual Markers:
- Green "BUY" labels below key buy K-lines
- Red "SELL" labels above key sell K-lines
- Clear channel visualization
Logic Flow:
- Tracks last signal direction to prevent consecutive same-type signals
- Strict conditions ensure only significant breakouts are marked
- All calculations based on your exact specifications
Скрипт с открытым кодом
В истинном духе TradingView, создатель этого скрипта сделал его открытым исходным кодом, чтобы трейдеры могли проверить и убедиться в его функциональности. Браво автору! Вы можете использовать его бесплатно, но помните, что перепубликация кода подчиняется нашим Правилам поведения.
Отказ от ответственности
Информация и публикации не предназначены для предоставления и не являются финансовыми, инвестиционными, торговыми или другими видами советов или рекомендаций, предоставленных или одобренных TradingView. Подробнее читайте в Условиях использования.