Momentum Oscillator
there is added options to draw the histogram or not, same for drawing the line or not indivitually
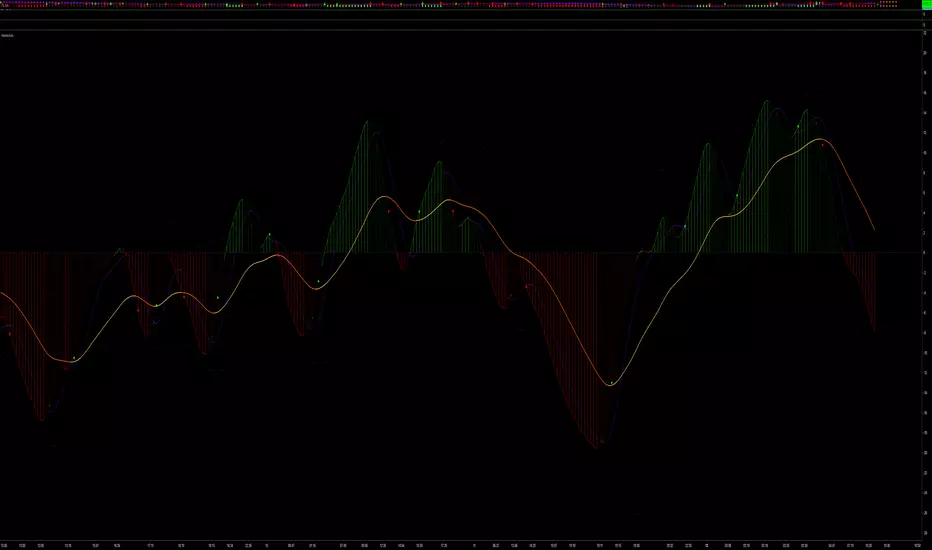
Thiis oscillator is almost finished with every chance and system you can put on it.
The top instance is what you would get by default, HLC3 as input and the number settings based on Barry's suggestions but uses SMA instead of EMA in macd calculations.
The second one is still using SMA and HLC3, but instead of Barry's suggested numbers for bar calculations, it's using Williams suggested numbers. As you see, the cross between MOM and DAD is happening much faster in time but there are instances of them going back and forth in crossing when the top one is not doing it.
The third instance is using Barry's suggested numbers, with SMA but uses MFI from Williams book.
The last instance is what you would get if you completely go with Bill Williams, the suggested bar calcultions, with MFI as input and SMA in calculations.
Added a 7 SMA for MOM
Added color signals for when MOM moves above / bellow 7 SMA and DAD
Moved plots around for better order on what draws on top of what
- Removed the cloud drawing between momentum and DAD, would make the chart look too busy
- Changed the way signals are being drawn from background bars to crosses on the oscillator itself
Скрипт с ограниченным доступом
Доступ к этому скрипту имеют только пользователи, одобренные автором. Вам необходимо запросить и получить разрешение на его использование. Обычно оно предоставляется после оплаты. Для получения подробной информации следуйте инструкциям автора ниже или свяжитесь напрямую с CAB_Member.
TradingView НЕ рекомендует оплачивать или использовать скрипт, если вы полностью не доверяете его автору и не понимаете, как он работает. Вы также можете найти бесплатные, открытые альтернативы в наших скриптах сообщества.
Инструкции от автора
Отказ от ответственности
Скрипт с ограниченным доступом
Доступ к этому скрипту имеют только пользователи, одобренные автором. Вам необходимо запросить и получить разрешение на его использование. Обычно оно предоставляется после оплаты. Для получения подробной информации следуйте инструкциям автора ниже или свяжитесь напрямую с CAB_Member.
TradingView НЕ рекомендует оплачивать или использовать скрипт, если вы полностью не доверяете его автору и не понимаете, как он работает. Вы также можете найти бесплатные, открытые альтернативы в наших скриптах сообщества.