OPEN-SOURCE SCRIPT
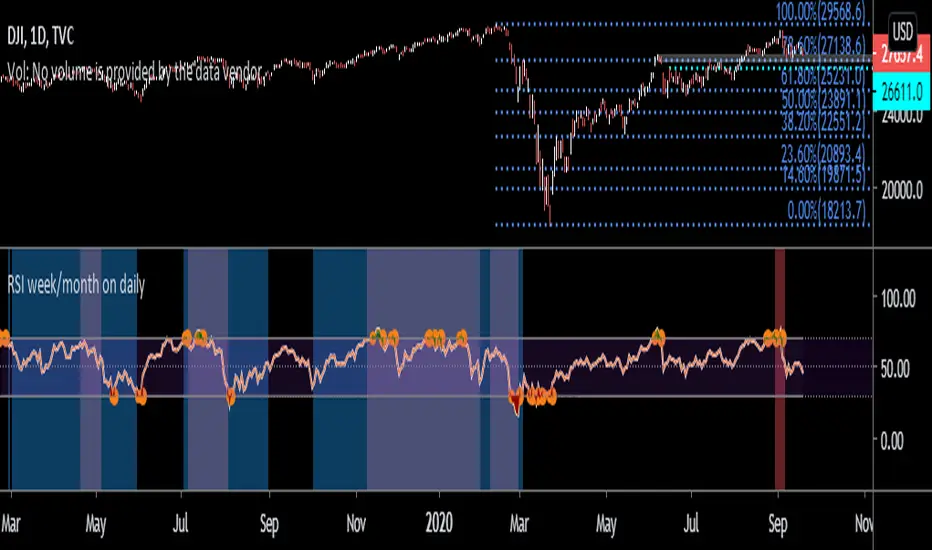
RSI week/month level on daily Time frame

- You can analyse the trend strength on daily time frame by looking of weekly and monthly is greater than 60.
- Divergence code is taken from tradingview's Divergence Indicator code.
#Strategy 1 : BUY ON DIPS
- This will help in identifying bullish zone of the price when RSI on DAILY, WEEKLY and Monthly is >60
-Take a trade when monthly and weekly rsi is >60 but daily RSI is less thaN 40.
- Divergence code is taken from tradingview's Divergence Indicator code.
#Strategy 1 : BUY ON DIPS
- This will help in identifying bullish zone of the price when RSI on DAILY, WEEKLY and Monthly is >60
-Take a trade when monthly and weekly rsi is >60 but daily RSI is less thaN 40.
Скрипт с открытым кодом
В истинном духе TradingView, создатель этого скрипта сделал его открытым исходным кодом, чтобы трейдеры могли проверить и убедиться в его функциональности. Браво автору! Вы можете использовать его бесплатно, но помните, что перепубликация кода подчиняется нашим Правилам поведения.
Отказ от ответственности
Информация и публикации не предназначены для предоставления и не являются финансовыми, инвестиционными, торговыми или другими видами советов или рекомендаций, предоставленных или одобренных TradingView. Подробнее читайте в Условиях использования.