OPEN-SOURCE SCRIPT
ZIP Entry Strategy( Using 50 SMA and 100 SMA)
Description:
This strategy uses only two simple moving averages, specifically the 50 SMA and the 100 SMA.
Simple moving average : A simple moving average (SMA) calculates the average of a selected range of prices, usually closing prices, by the number of periods in that range.
Here's how it works:
Background color:
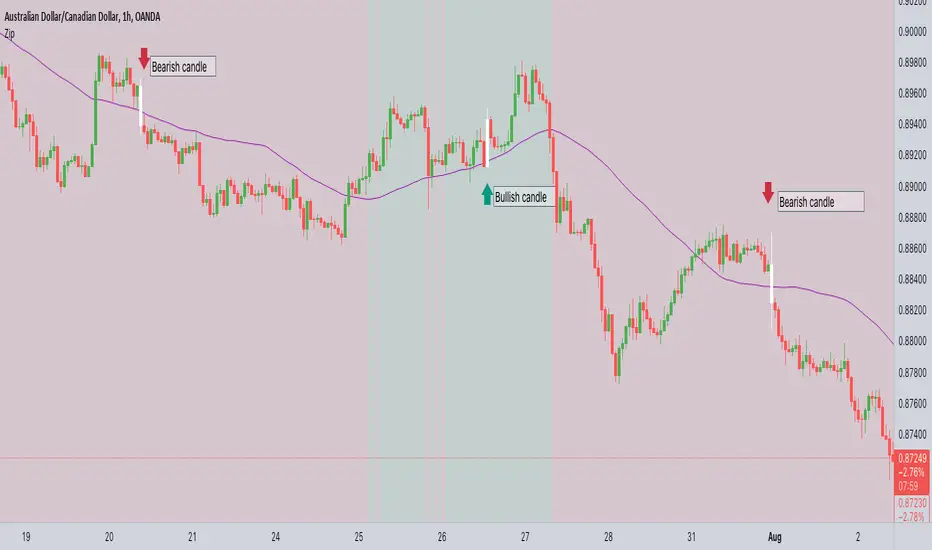
The chart background is colored green when the price is above the 100 SMA.
The chart background turns red when the price is below the 100 SMA.
The greenback ground suggest the bullish momentum and the red background suggests the bearish momentum.
We can use this long term trend to take the trades in alignment with the trend to increase our odds.
We will use the 50 SMA to identify the spots when a new trend is starting. When the price crosses above the 50 SMA while the background is green, the candle/bar color changes to white indicating a new trend beginning.
Conversely, when the price crosses below the 50 SMA while the background is red, the candle/bar color also changes to white indicating a new trend beginning.
The occurrence of white candles indicates the start of a potential new trend in alignment with the long term trend.
However, it's essential to remember that like any trading strategy, this one is not perfect. For more reliable results, it's advisable to combine it with a consideration of the overall price structure to minimize false entry signals.
Originality and usefulness
Even though it makes use of two moving averages, we don't use the moving average crossover. The moving average crossovers are either lagging or provide too many false signals. We have tried to address these issue with this strategy. While maintaining the long-term trend and ignoring false signals, it gives out signals early.
You can choose the moving average that best suits your needs by changing these moving averages to a different moving average . The 50 SMA and 100 SMA appeared to be giving the better signals in my experience.
I dont use any other indicators but i would like to check the price structure to make sure its moving along with the 50 SMA. Sometimes the choppy markets might give false signals.
Its okay to see multiple white candles as long as the price structure holds.
I have highlighted the white candles in the above chart. The color of the candle is always the same so the background decides whether its bearish or bullish cross
This strategy uses only two simple moving averages, specifically the 50 SMA and the 100 SMA.
Simple moving average : A simple moving average (SMA) calculates the average of a selected range of prices, usually closing prices, by the number of periods in that range.
Here's how it works:
Background color:
The chart background is colored green when the price is above the 100 SMA.
The chart background turns red when the price is below the 100 SMA.
The greenback ground suggest the bullish momentum and the red background suggests the bearish momentum.
We can use this long term trend to take the trades in alignment with the trend to increase our odds.
We will use the 50 SMA to identify the spots when a new trend is starting. When the price crosses above the 50 SMA while the background is green, the candle/bar color changes to white indicating a new trend beginning.
Conversely, when the price crosses below the 50 SMA while the background is red, the candle/bar color also changes to white indicating a new trend beginning.
The occurrence of white candles indicates the start of a potential new trend in alignment with the long term trend.
However, it's essential to remember that like any trading strategy, this one is not perfect. For more reliable results, it's advisable to combine it with a consideration of the overall price structure to minimize false entry signals.
Originality and usefulness
Even though it makes use of two moving averages, we don't use the moving average crossover. The moving average crossovers are either lagging or provide too many false signals. We have tried to address these issue with this strategy. While maintaining the long-term trend and ignoring false signals, it gives out signals early.
You can choose the moving average that best suits your needs by changing these moving averages to a different moving average . The 50 SMA and 100 SMA appeared to be giving the better signals in my experience.
I dont use any other indicators but i would like to check the price structure to make sure its moving along with the 50 SMA. Sometimes the choppy markets might give false signals.
Its okay to see multiple white candles as long as the price structure holds.
I have highlighted the white candles in the above chart. The color of the candle is always the same so the background decides whether its bearish or bullish cross
Скрипт с открытым кодом
В истинном духе TradingView, создатель этого скрипта сделал его открытым исходным кодом, чтобы трейдеры могли проверить и убедиться в его функциональности. Браво автору! Вы можете использовать его бесплатно, но помните, что перепубликация кода подчиняется нашим Правилам поведения.
Отказ от ответственности
Информация и публикации не предназначены для предоставления и не являются финансовыми, инвестиционными, торговыми или другими видами советов или рекомендаций, предоставленных или одобренных TradingView. Подробнее читайте в Условиях использования.