OPEN-SOURCE SCRIPT
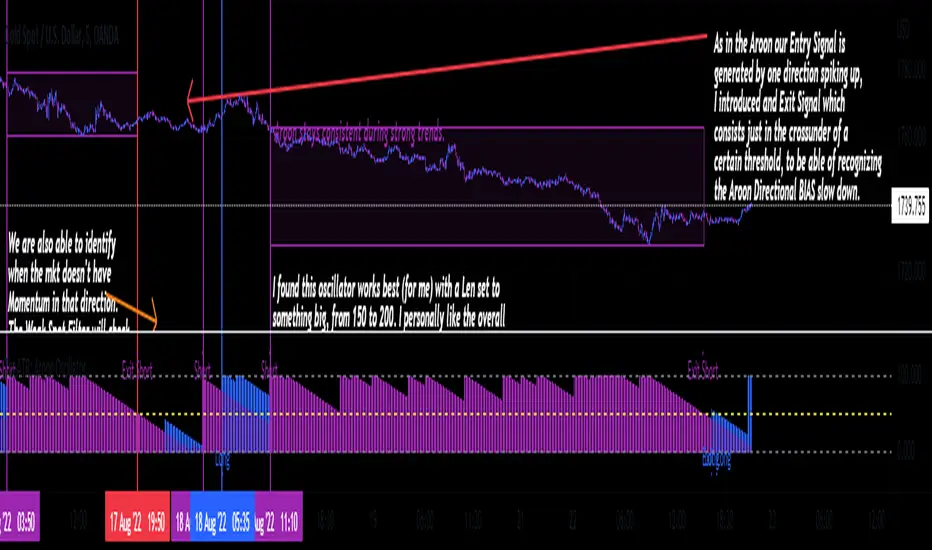
TheATR: Aroon Oscillator.

Aroon Oscillator (AO).
The Aroon Oscillator, was developed by Tushar Chande, in 1995, to highlight the start of a new trend and to measure trend strength.
I re-branded a bit the whole thing, If you are familiar with how this Oscillator usually is, you are going to notice the differences.
Aroon Oscillator Components.
1 - Aroon Up -> Bullish Directional Component, highlighted in blue.
2 - Aroon Down -> Bearish Directional Component, highlighted in purple.
We also have the Oscillators static thresholds, which are:
- 0 Line.
- 100 Line.
- Exit Signal Line Level.
How to read the Aroon Oscillator.
The AO main goal, is to identify the trend from its first stages, to then come up with how strong that trend is.
So, classic interpretation for the AO would be:
-Aroon Up>Aroon Down = Bull Scenario.
-Aroon Up<Aroon Down = Bear Scenario.
There's also a filter I added, called "Weak Spots Filter". It's purpose goes alongside with how the Aroon present its signals, which a big spike, that usually reaches the top range of the Oscillator, for both Long and Short cases.
So, if the momentum of the market fails to push the Aroon up to a specific level (Exit Signal Line Level), the Filter says market's not strong, and therefore signal is not valid.
The same level (Exit Signal Line Level) allows the user to set Exit Signals for the AO.
I found Exit Signal extremely powerful in this oscillator, as they way they're structured aims to capture the slow down of the trend, which may be followed by the market reversing.
TheATR Documentation regarding TheATR: Aroon Oscillator.
I pretty much already say what I love about the Aroon: It's Exit Signals.
Those are the most valuable part of the Oscillator, by far, in my opinion.
Also, I noticed it gives nice trend recognition when the lenght it's set to
big number (from 150 to 200, for ex).
But. I would never use JUST the Aroon, to decide when to enter and exit the market.
I think it may be an outstanding player if its in a team, where it should play a defensive role.
But that's just my way of using it. I wish you find profitable ways too!
Thanks for reading,
TheATR.
Скрипт с открытым кодом
В истинном духе TradingView, создатель этого скрипта сделал его открытым исходным кодом, чтобы трейдеры могли проверить и убедиться в его функциональности. Браво автору! Вы можете использовать его бесплатно, но помните, что перепубликация кода подчиняется нашим Правилам поведения.
Отказ от ответственности
Информация и публикации не предназначены для предоставления и не являются финансовыми, инвестиционными, торговыми или другими видами советов или рекомендаций, предоставленных или одобренных TradingView. Подробнее читайте в Условиях использования.