3D WAVE-PM (3x Res Log 625-2000) [acatwithcharts]
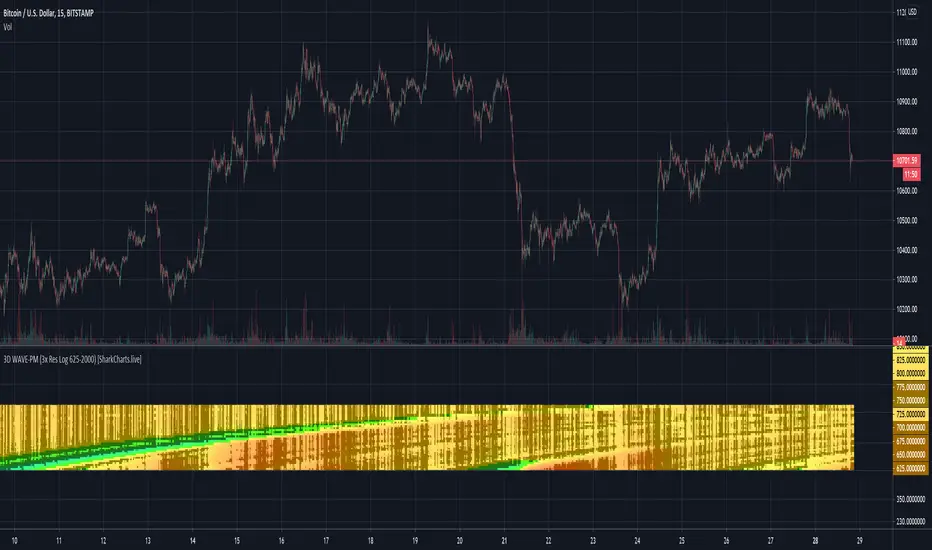
In 3D WAVE-PM, I plotted 32 period lengths from 14 to 600 at height equal to their length, reading out colors based on their value. I chose those lengths to create a relatively continuous indicator on log scale.
What I really wanted to do though was to (1) have the option to view this indicator in either linear or log and (2) not lose as much data resolution across nearly 600 periods. Within the limitations of Pinescript, the best solution I could find was to make multiple indicators hard-coding the different period lengths to create linear and log ranges such that I could make a composite heatmap with several different indicators on the same pane.
...but then I went a step further on the log scale version, noticing that I could easily make a 4th indicator that covers the 625-2000 period region at similar resolution to the other 3. So I did. This is therefore the "4th of 3 indicators" for log scale 3x resolution WAVE-PM.
It adds significant lag on top of what was already caused by 3x WAVE-PM, but I have found it broadly useful enough when looking at large expansions that I'm going to go ahead and launch it. I strongly recommend doing any other analysis in a separate tab from the one in which you have high-res 3D indicators open.
I'm excited to announce that we're putting the finishing touches on a subscription service for the volatility theory indicators, and assuming no hiccups will launch them within days. Subscriptions will be available in several packages through SharkCharts.live
Current pricing and subscription details will be kept up-to-date on SharkCharts.live
Скрипт с ограниченным доступом
Доступ к этому скрипту имеют только пользователи, одобренные автором. Вам необходимо запросить и получить разрешение на его использование. Обычно оно предоставляется после оплаты. Для получения подробной информации следуйте инструкциям автора ниже или свяжитесь напрямую с acatwithcharts.
TradingView НЕ рекомендует оплачивать или использовать скрипт, если вы полностью не доверяете его автору и не понимаете, как он работает. Вы также можете найти бесплатные, открытые альтернативы в наших скриптах сообщества.
Инструкции от автора
Feel free to reach out to me with any questions; more information is available on the SharkCharts website and the SharkCharts discord discord.gg/YVpTeSK
Отказ от ответственности
Скрипт с ограниченным доступом
Доступ к этому скрипту имеют только пользователи, одобренные автором. Вам необходимо запросить и получить разрешение на его использование. Обычно оно предоставляется после оплаты. Для получения подробной информации следуйте инструкциям автора ниже или свяжитесь напрямую с acatwithcharts.
TradingView НЕ рекомендует оплачивать или использовать скрипт, если вы полностью не доверяете его автору и не понимаете, как он работает. Вы также можете найти бесплатные, открытые альтернативы в наших скриптах сообщества.
Инструкции от автора
Feel free to reach out to me with any questions; more information is available on the SharkCharts website and the SharkCharts discord discord.gg/YVpTeSK