PROTECTED SOURCE SCRIPT
Обновлено Monthly Pattern Analysis (15 Years Historical View)
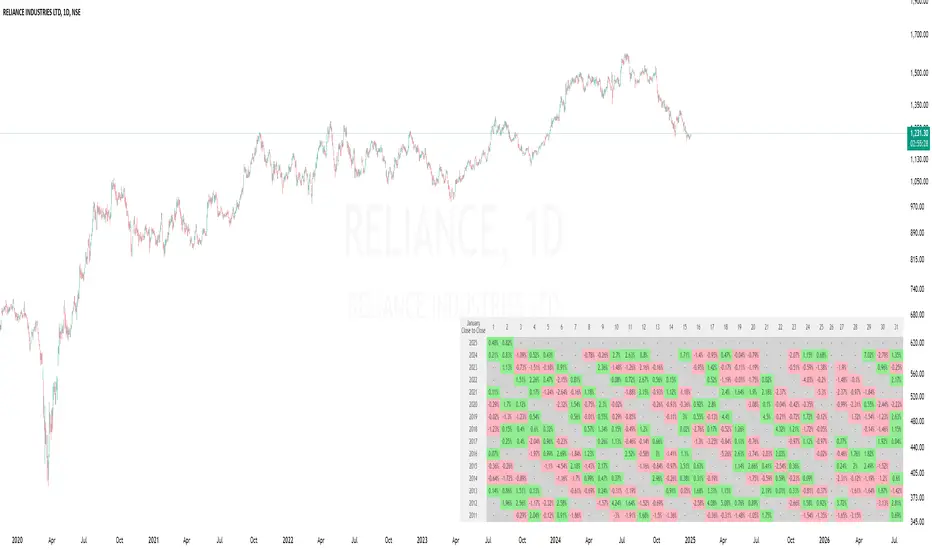
Monthly Pattern Analysis (15 Years Historical View)
This indicator creates a comprehensive visual matrix showing daily percentage changes for any selected month across the last 15 years. Perfect for analyzing historical patterns and seasonality in price movements.
Features:
- Month Selection: Choose any month to analyze (defaults to current month)
- 15-Year History: Shows data from current year back to 15 years
- Flexible Calculations: Choose between "Close to Close" or "Open to Close" percentage changes
- Color-Coded Returns: Green for positive returns, Red for negative returns
- Customizable Display: Adjust table size, position, and colors
- Daily Granularity: Shows changes for each trading day of the selected month
Usage:
1. Apply to any daily chart
2. Select your desired month from settings
3. Choose calculation method (Close-to-Close or Open-to-Close)
4. Customize table appearance as needed
Perfect for:
- Seasonal pattern analysis
- Historical performance comparison
- Month-specific trading strategies
- Long-term market behavior study
Note: Indicator requires Daily timeframe for accurate calculations.
Информация о релизе
Table size changed to small to display in the available screen size, can be changed to Normal or Large as per the requirement from the Indicator settings.Скрипт с защищённым кодом
Этот скрипт опубликован с закрытым исходным кодом. Однако вы можете использовать его свободно и без каких-либо ограничений — читайте подробнее здесь.
Отказ от ответственности
Информация и публикации не предназначены для предоставления и не являются финансовыми, инвестиционными, торговыми или другими видами советов или рекомендаций, предоставленных или одобренных TradingView. Подробнее читайте в Условиях использования.
Скрипт с защищённым кодом
Этот скрипт опубликован с закрытым исходным кодом. Однако вы можете использовать его свободно и без каких-либо ограничений — читайте подробнее здесь.
Отказ от ответственности
Информация и публикации не предназначены для предоставления и не являются финансовыми, инвестиционными, торговыми или другими видами советов или рекомендаций, предоставленных или одобренных TradingView. Подробнее читайте в Условиях использования.