OPEN-SOURCE SCRIPT
Clustered Asset Moving Average @shrilss
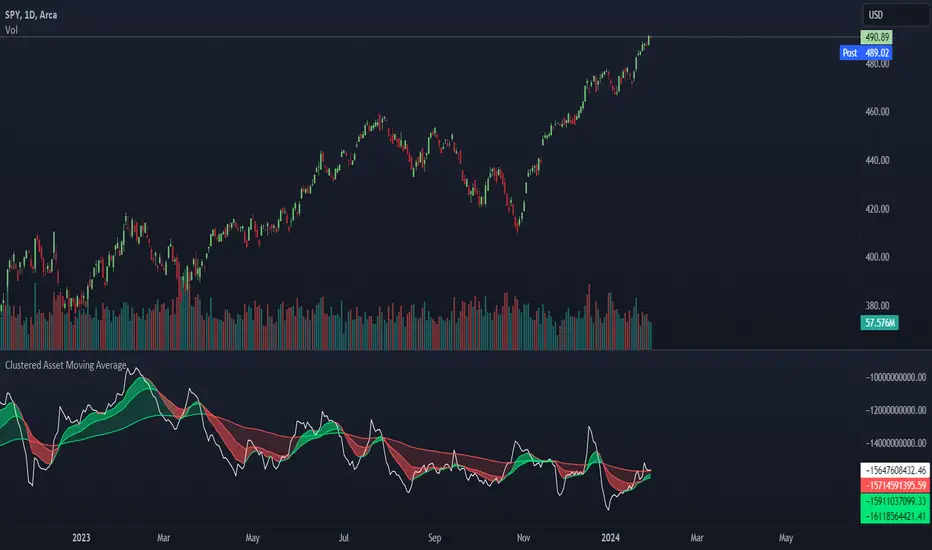
The Clustered Asset Moving Average script is designed to provide traders with a unique perspective on a cluster of multiple assets. By combining the closing prices and volumes of 12 specified assets, this indicator calculates a Clustered Moving Average to reveal potential trends and market sentiment within this asset cluster.
Key Features:
- Asset Cluster Analysis:
The script considers 12 assets, including well-known names such as Google (GOOG), Microsoft (MSFT), Apple (AAPL), Tesla (TSLA), and others.
It calculates the price and volume of each asset to form a comprehensive view of the asset cluster.
- Clustered Moving Average Calculation:
The Asset Price and Volume are combined to calculate the Clustered Moving Average
This moving average reflects the relationship between the aggregated price and volume of the specified assets.
- Multiple Exponential Moving Averages (EMA):
The script includes three EMAs (10, 25, and 100) applied to the Clustered Moving Average, providing different time perspectives.
Users can customize the visibility of each EMA based on their trading preferences.
- Visual Representation:
The indicator offers a visual representation of the Clustered Moving Average, allowing traders to quickly identify trends and potential reversal points.
Different EMAs are color-coded, enhancing visual clarity.
Скрипт с открытым кодом
В истинном духе TradingView, создатель этого скрипта сделал его открытым исходным кодом, чтобы трейдеры могли проверить и убедиться в его функциональности. Браво автору! Вы можете использовать его бесплатно, но помните, что перепубликация кода подчиняется нашим Правилам поведения.
Отказ от ответственности
Информация и публикации не предназначены для предоставления и не являются финансовыми, инвестиционными, торговыми или другими видами советов или рекомендаций, предоставленных или одобренных TradingView. Подробнее читайте в Условиях использования.