OPEN-SOURCE SCRIPT
Обновлено Foxy's Acceleration Bands

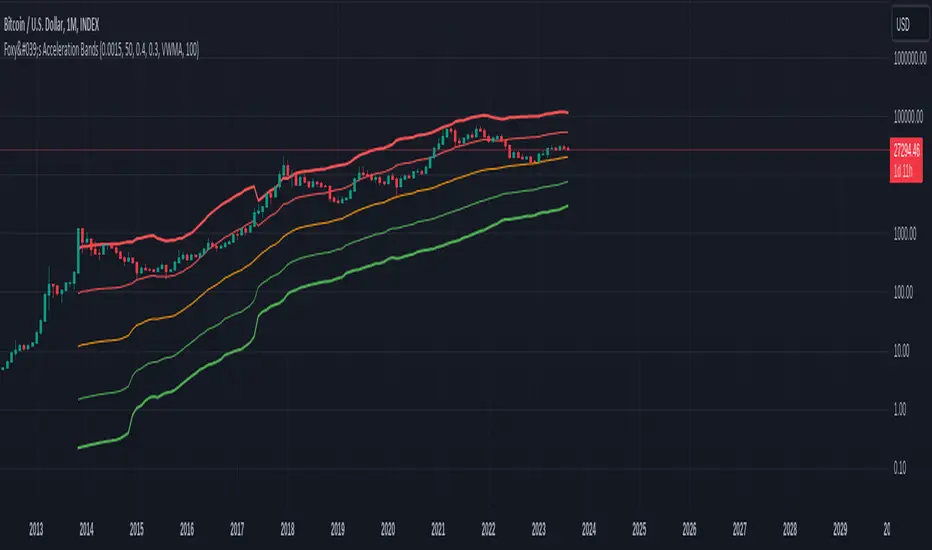
Foxy's Acceleration Bands is a dynamic technical indicator designed to help traders identify potential support and resistance levels using logarithmic regression and adaptable moving averages. By plotting bands around price movements, this indicator offers insights into potential zones where price acceleration, resistance, and support might occur.
How to Use:
Apply the "Foxy's Acceleration Bands" indicator to your TradingView chart.
Customize the indicator parameters as per your requirements:
factor: Adjust the sensitivity of the bands.
length: Set the length for moving averages and regression calculations.
mult: Modify the multiplier for upper bands.
Show Middle Bands: Toggle the display of middle bands.
Show Upper Bands: Toggle the display of upper bands.
Band MA Type: Choose the moving average type for the bands.
Middle MA Type: Select the moving average type for the central band.
Draw Prediction: Enable prediction lines for potential future price trends.
Prediction Slope Type: Choose between a fixed or dynamic slope length for prediction lines.
Fixed Slope Length: Set the slope length for prediction lines (if enabled).
Interpretation:
Upper Bands: The red upper bands indicate potential resistance zones where price acceleration might occur.
Middle Bands: The orange central band provides insights into the prevailing price trend.
Lower Bands: The green lower bands suggest potential support zones where price deceleration might happen.
Prediction Lines: If enabled, dotted lines visualize potential future price trends based on historical data.
Important Note: Foxy's Acceleration Bands is designed to assist traders in identifying potential support and resistance zones. Always complement its insights with other analysis techniques and prudent risk management strategies.
Информация о релизе
Update Default MA and Some ParametersИнформация о релизе
Add Volume Average For SmoothingИнформация о релизе
Add Volume Paramter and Tweak Default ParametersИнформация о релизе
Clean-up & Refactor & Better FunctionalityИнформация о релизе
Add Volume SmoothingИнформация о релизе
Update Default ParameterИнформация о релизе
Add Adaptive MAИнформация о релизе
Fix BugИнформация о релизе
Fix Major bugИнформация о релизе
Revert Last Fix (Doesn't Work Properly)Информация о релизе
Add Super Fast BandИнформация о релизе
Fix Default ParameterИнформация о релизе
Add Auto-LengthИнформация о релизе
Fix Length SelectorИнформация о релизе
Fix Adaptive MAИнформация о релизе
Fix Default Timeframes LengthИнформация о релизе
Fix Auto TimeframesИнформация о релизе
Fix Length Selector ValueИнформация о релизе
Fix Log IssueИнформация о релизе
Fix typoИнформация о релизе
Fix Log Issue #2Информация о релизе
Comment the un-needed functionСкрипт с открытым кодом
В истинном духе TradingView, создатель этого скрипта сделал его открытым исходным кодом, чтобы трейдеры могли проверить и убедиться в его функциональности. Браво автору! Вы можете использовать его бесплатно, но помните, что перепубликация кода подчиняется нашим Правилам поведения.
Отказ от ответственности
Информация и публикации не предназначены для предоставления и не являются финансовыми, инвестиционными, торговыми или другими видами советов или рекомендаций, предоставленных или одобренных TradingView. Подробнее читайте в Условиях использования.
Скрипт с открытым кодом
В истинном духе TradingView, создатель этого скрипта сделал его открытым исходным кодом, чтобы трейдеры могли проверить и убедиться в его функциональности. Браво автору! Вы можете использовать его бесплатно, но помните, что перепубликация кода подчиняется нашим Правилам поведения.
Отказ от ответственности
Информация и публикации не предназначены для предоставления и не являются финансовыми, инвестиционными, торговыми или другими видами советов или рекомендаций, предоставленных или одобренных TradingView. Подробнее читайте в Условиях использования.