OPEN-SOURCE SCRIPT
تلوين الشموع حسب الحجم (يومي أو متوسط)
📊 Indicator Name:
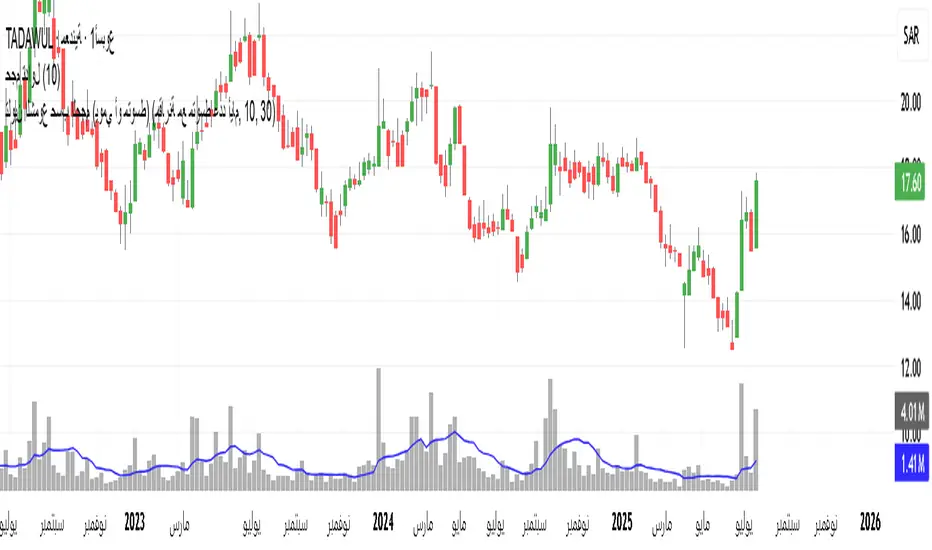
Candle Coloring Based on Volume Change (Flexible Comparison)
🎯 Purpose of the Indicator:
This indicator colors candlesticks based solely on changes in volume, regardless of price direction. It helps traders visualize unusual volume activity and potential accumulation or distribution zones.
It also displays the percentage change in volume above each candle — based on a comparison method chosen by the user.
⚙️ User Inputs:
Comparison Method (Mode):
"Compare with Previous Day":
The volume of the current candle is compared with the volume of the previous candle.
"Compare with Average of N Days":
The volume is compared with a moving average of volume over a number of past days (e.g., 10 days).
Average Length (for mode 2):
Used only when "Compare with Average" is selected.
Defines the number of days over which to calculate the volume average.
Minimum % Change to Show Label:
A threshold that controls when the percentage label appears.
Prevents label clutter for insignificant volume changes.
🎨 Candle Coloring Logic:
Condition Meaning Candle Color
Current volume > reference volume High activity 🟢 Green
Current volume < reference volume Low activity 🔴 Red
Nearly equal volumes Normal ⚪ Gray
🏷️ Volume Change Label:
The indicator displays a percentage change label above the candle.
For example:
If volume increased by 45% → label shows +45.00%.
If the change exceeds ±50%, the label turns yellow to indicate a significant spike.
✅ Key Benefits:
Quickly detects unusual volume activity (e.g., spikes, drops).
Enhances classic price-action analysis with volume context.
Flexible comparison:
Day-to-day for short-term traders.
Moving average for swing and position traders.
Clean, minimalist design with conditional labels.
🔍 Use Case Examples:
🔴 Red candle on price rise → weak rally (low participation).
🟢 Green candle on price drop → potential distribution.
⚪ Gray candles → sideways or stable behavior.
👤 Who Should Use It?
Day traders and scalpers monitoring volume strength.
Technical analysts who focus on volume-price behavior.
Traders who track accumulation/distribution patterns.
Скрипт с открытым кодом
В истинном духе TradingView, создатель этого скрипта сделал его открытым исходным кодом, чтобы трейдеры могли проверить и убедиться в его функциональности. Браво автору! Вы можете использовать его бесплатно, но помните, что перепубликация кода подчиняется нашим Правилам поведения.
محمد الشمري
Отказ от ответственности
Информация и публикации не предназначены для предоставления и не являются финансовыми, инвестиционными, торговыми или другими видами советов или рекомендаций, предоставленных или одобренных TradingView. Подробнее читайте в Условиях использования.