PROTECTED SOURCE SCRIPT
Обновлено Trade History Label Display On Chart (Copy-paste from Rakuten)
Overview
This script automatically displays buy/sell labels on the chart simply by copying and pasting your trade history (execution records) exported from Rakuten Securities in Excel format.
It also automatically calculates the profit and loss for each trade.
Background
When reviewing one’s trades, manually matching the broker’s execution records — “date, time, symbol, number of shares, buy or sell” — with the exact points on the chart can be extremely time-consuming.
This is especially inefficient for day traders and scalpers, who may execute dozens of trades per day.
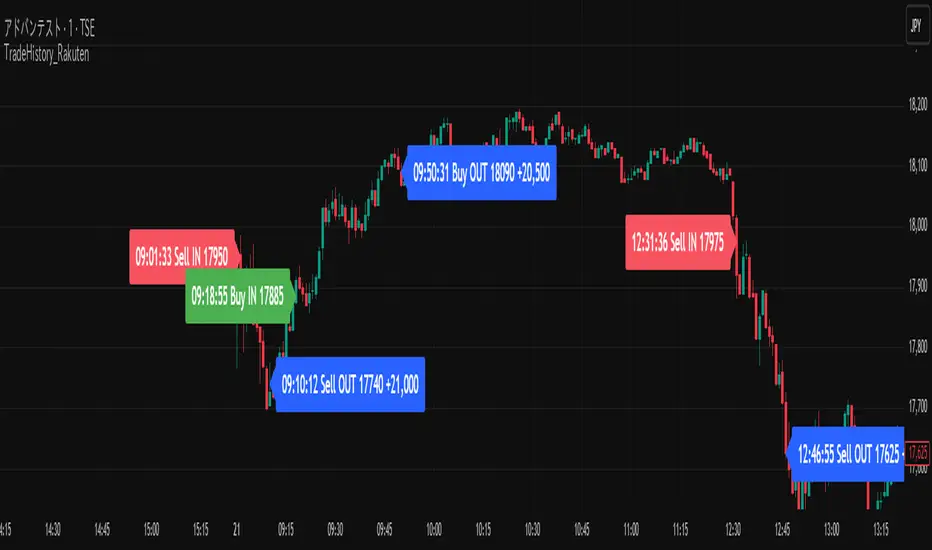
With this script, you can automatically display the entry (IN) and exit (OUT) points on your chart as labels.
It’s also useful when attaching charts to your trading notes or journals, as you can visually confirm exactly where you entered and exited, greatly speeding up the review process.
The script also supports multiple symbols.
Even if you paste a combined dataset containing trades for several stocks, only the trades for the currently displayed symbol will appear automatically.
This allows you to maintain a single master record and instantly visualize the relevant trades just by switching charts.
How to Use
1. Preparing your Excel data
(1)Export trade history
Export your trade history as a CSV file from Rakuten Securities MarketSpeed II, etc.
If you want to include detailed execution times (seconds), make sure to export the data on the same day.
If you export later as a batch, only the date will remain — the time information (hh:mm:ss) will be lost.
(2)Open and format in Excel
Always open the CSV file in Excel — not in Notepad.
If opened in Notepad, double quotes (") will be automatically added, which makes the script unable to recognize the data correctly.
If you need to include seconds in the execution date/time, set a custom format in Excel as follows:
yyyy/mm/dd hh:mm:ss
Copy the range from Execution Date (Column A) to Execution Price (Column L).
Do not include header rows.
Copy data only. Including the header line will cause parsing errors in the script.
(3)If you create a memo column
You can add a Memo column (Column M) next to the “Execution Price” column.
Anything written here (e.g., trade reasoning or notes) will appear on the chart labels.
If you add a memo column, copy the range from Execution Date (A) to Memo (M) when pasting into the script.
Again, copy only the data (not headers). Including column names will cause errors.
2. Paste data into TradingView
Open the script settings and paste the copied data into the text area labeled “Trade Data Paste Area.”
The script automatically parses the text and recognizes date, time, symbol, trade type, position type, credit type, quantity, price, and memo, displaying them as labels at the correct bar.
You can paste data for multiple stocks at once.
Only the rows matching the currently displayed chart’s symbol will be plotted.
3. Display settings (ON/OFF controls)
Each label element (credit type, position type, quantity, memo, etc.) can be turned ON/OFF individually in the script settings via checkboxes (input.bool).
If you’ve created a memo column, its content will also appear on the label.
4. Checking on the chart
Each trade’s entry and exit are shown directly above or below the relevant candlestick.
You can switch between daily and intraday timeframes for more detailed inspection.
Labels are color-coded (e.g., Buy / Sell / Settlement) for quick visual recognition.
When switching symbols, only the relevant trade labels for that symbol will automatically appear.
5. Notes
The script is designed for use on 1-minute to daily charts.
If there’s no matching candlestick for a given trade date/time, the label may not display correctly.
Data input is manual paste only (automatic import not supported).
CSV files must be edited in Excel. Other editors may alter the text format, causing parsing errors.
Due to Pine Script limitations, input.text_area can hold a maximum of 40,960 characters.
The script is tailored for Rakuten Securities’ export format.
Using data from other brokers may require aligning column structures.
If Rakuten changes its export format, the script may need adjustment.
--------------------------------------------------------------------------------------------
概要
このスクリプトは、楽天証券の約定履歴(取引記録)をExcelからコピーして貼り付けるだけで、チャート上に売買ラベルを自動表示するツールです。
また、各取引の損益も自動で計算されます。
背景
自分のトレードを振り返る際、証券会社の約定記録から「何月何日何時何分、どの銘柄を、何株、買った・売った」を確認して、チャート上の位置と突き合わせる作業は非常に時間がかかります。
特にデイトレードやスキャルピングをしていると、1日に数十件以上の約定が発生し、手動で位置を確認するのは非効率です。
このスクリプトを使えば、IN・OUTのタイミングをチャート上にラベルとして自動表示できます。
自分のトレードノート、トレード日記にチャート画像を貼り付ける際も利用でき、チャートのどこでエントリー/決済したかを視覚的に確認できるため、振り返り作業が大幅に効率化されます。
また、複数銘柄に対応しており、貼り付けたデータの中から現在表示中のチャート銘柄と一致する売買履歴だけを抽出・表示します。
これにより、複数銘柄分の約定記録を一括管理していても、チャートを切り替えるだけで該当銘柄の取引履歴を瞬時に可視化できます。
使用方法
1. Excelデータの準備
(1)約定履歴のエクスポート
楽天証券マーケットスピードⅡなどから約定履歴をCSV形式でエクスポートします。
約定の詳細な時刻(時分秒単位)データを取得したい場合は、必ず当日中にエクスポートしてください。後日まとめて過去分をエクスポートしても、日付までしか記録されず、時刻情報(hh:mm:ss)は失われます。
(2)Excelで開いて整形
CSVは必ずExcelで開いて編集してください。メモ帳で開くと "(ダブルクォーテーション) が自動的に付与され、スクリプトが正しく認識できません。
約定日の秒単位までを扱いたい場合は、Excelのセル書式設定を開き、「ユーザー定義」で次の形式を新規作成して適用します。書式を変更しないでコピーした場合は分までのデータとなり、スクリプトは00秒と認識します。
yyyy/mm/dd hh:mm:ss
約定日(A列)~約定単価(L列)までのデータ部分をコピーする。
※このとき、項目名(ヘッダー行)は含めず、データ部分のみをコピーしてください。項目名を含めるとスクリプトが誤認識してエラーになります
(3)メモ欄を作成する場合
約定単価の右隣の列(M列)を「メモ欄」として利用できます。ここにエントリー根拠など任意のメモを書いておくとラベル上でもメモを確認できます。
メモ欄を作成した場合は、約定日(A列)からメモ欄(M列)までをコピーして貼り付けてください。
※このとき、項目名(ヘッダー行)は含めず、データ部分のみをコピーしてください。項目名を含めるとスクリプトが誤認識してエラーになります。
2. データをTradingViewに貼り付ける
スクリプトの設定画面を開き、「取引データ貼り付け欄」にExcelからコピーしたデータをそのまま貼り付けます。
スクリプトが自動でテキストを解析し、日付・時刻・銘柄コード・取引区分・建玉区分・信用区分・数量・単価・メモなどを認識して、ラベルをチャート上に自動配置します。
複数銘柄のデータを一度に貼り付けても問題ありません。現在表示中のチャート銘柄と一致する行だけがラベルとして描画されます。
3. 表示設定(ON/OFF切り替え)
各表示要素(信用区分・建玉区分・数量・メモなど)は、設定画面のチェックボックス(input.bool)で個別に表示/非表示を切り替えられます。
メモ欄を作成している場合は、その内容もラベルに表示されます。
4. チャートでの確認
各取引のIN・OUTが、チャート上の該当バー(ローソク足)にラベルとして表示されます。
日足・分足を切り替えることで、より詳細なタイミングを確認できます。
ラベルは、買い(Buy)・売り(Sell)・返済などで色分けされ、視覚的に理解しやすい構成になっています。
チャートを銘柄ごとに切り替えるだけで、その銘柄の取引履歴のみが自動表示されます。
5. 注意点
このスクリプトは 1分足~日足 での使用を想定しています。データ上の日付や時刻に対応するローソク足が存在しない場合、ラベルを正しく表示できません。
データは手動貼り付け方式です。自動取得には対応していません。
Excel以外のアプリで開いたCSVは、文字列形式が変わるため解析できないことがあります。
Pineスクリプトの仕様上、テキストエリアには40,960文字までしか貼り付けできません。
楽天証券の出力フォーマットを想定しているため、他社形式を使う場合は列構成を揃える必要があります。
また、楽天証券の出力フォーマットが変更された場合は、正しく表示出来なります。
This script automatically displays buy/sell labels on the chart simply by copying and pasting your trade history (execution records) exported from Rakuten Securities in Excel format.
It also automatically calculates the profit and loss for each trade.
Background
When reviewing one’s trades, manually matching the broker’s execution records — “date, time, symbol, number of shares, buy or sell” — with the exact points on the chart can be extremely time-consuming.
This is especially inefficient for day traders and scalpers, who may execute dozens of trades per day.
With this script, you can automatically display the entry (IN) and exit (OUT) points on your chart as labels.
It’s also useful when attaching charts to your trading notes or journals, as you can visually confirm exactly where you entered and exited, greatly speeding up the review process.
The script also supports multiple symbols.
Even if you paste a combined dataset containing trades for several stocks, only the trades for the currently displayed symbol will appear automatically.
This allows you to maintain a single master record and instantly visualize the relevant trades just by switching charts.
How to Use
1. Preparing your Excel data
(1)Export trade history
Export your trade history as a CSV file from Rakuten Securities MarketSpeed II, etc.
If you want to include detailed execution times (seconds), make sure to export the data on the same day.
If you export later as a batch, only the date will remain — the time information (hh:mm:ss) will be lost.
(2)Open and format in Excel
Always open the CSV file in Excel — not in Notepad.
If opened in Notepad, double quotes (") will be automatically added, which makes the script unable to recognize the data correctly.
If you need to include seconds in the execution date/time, set a custom format in Excel as follows:
yyyy/mm/dd hh:mm:ss
Copy the range from Execution Date (Column A) to Execution Price (Column L).
Do not include header rows.
Copy data only. Including the header line will cause parsing errors in the script.
(3)If you create a memo column
You can add a Memo column (Column M) next to the “Execution Price” column.
Anything written here (e.g., trade reasoning or notes) will appear on the chart labels.
If you add a memo column, copy the range from Execution Date (A) to Memo (M) when pasting into the script.
Again, copy only the data (not headers). Including column names will cause errors.
2. Paste data into TradingView
Open the script settings and paste the copied data into the text area labeled “Trade Data Paste Area.”
The script automatically parses the text and recognizes date, time, symbol, trade type, position type, credit type, quantity, price, and memo, displaying them as labels at the correct bar.
You can paste data for multiple stocks at once.
Only the rows matching the currently displayed chart’s symbol will be plotted.
3. Display settings (ON/OFF controls)
Each label element (credit type, position type, quantity, memo, etc.) can be turned ON/OFF individually in the script settings via checkboxes (input.bool).
If you’ve created a memo column, its content will also appear on the label.
4. Checking on the chart
Each trade’s entry and exit are shown directly above or below the relevant candlestick.
You can switch between daily and intraday timeframes for more detailed inspection.
Labels are color-coded (e.g., Buy / Sell / Settlement) for quick visual recognition.
When switching symbols, only the relevant trade labels for that symbol will automatically appear.
5. Notes
The script is designed for use on 1-minute to daily charts.
If there’s no matching candlestick for a given trade date/time, the label may not display correctly.
Data input is manual paste only (automatic import not supported).
CSV files must be edited in Excel. Other editors may alter the text format, causing parsing errors.
Due to Pine Script limitations, input.text_area can hold a maximum of 40,960 characters.
The script is tailored for Rakuten Securities’ export format.
Using data from other brokers may require aligning column structures.
If Rakuten changes its export format, the script may need adjustment.
--------------------------------------------------------------------------------------------
概要
このスクリプトは、楽天証券の約定履歴(取引記録)をExcelからコピーして貼り付けるだけで、チャート上に売買ラベルを自動表示するツールです。
また、各取引の損益も自動で計算されます。
背景
自分のトレードを振り返る際、証券会社の約定記録から「何月何日何時何分、どの銘柄を、何株、買った・売った」を確認して、チャート上の位置と突き合わせる作業は非常に時間がかかります。
特にデイトレードやスキャルピングをしていると、1日に数十件以上の約定が発生し、手動で位置を確認するのは非効率です。
このスクリプトを使えば、IN・OUTのタイミングをチャート上にラベルとして自動表示できます。
自分のトレードノート、トレード日記にチャート画像を貼り付ける際も利用でき、チャートのどこでエントリー/決済したかを視覚的に確認できるため、振り返り作業が大幅に効率化されます。
また、複数銘柄に対応しており、貼り付けたデータの中から現在表示中のチャート銘柄と一致する売買履歴だけを抽出・表示します。
これにより、複数銘柄分の約定記録を一括管理していても、チャートを切り替えるだけで該当銘柄の取引履歴を瞬時に可視化できます。
使用方法
1. Excelデータの準備
(1)約定履歴のエクスポート
楽天証券マーケットスピードⅡなどから約定履歴をCSV形式でエクスポートします。
約定の詳細な時刻(時分秒単位)データを取得したい場合は、必ず当日中にエクスポートしてください。後日まとめて過去分をエクスポートしても、日付までしか記録されず、時刻情報(hh:mm:ss)は失われます。
(2)Excelで開いて整形
CSVは必ずExcelで開いて編集してください。メモ帳で開くと "(ダブルクォーテーション) が自動的に付与され、スクリプトが正しく認識できません。
約定日の秒単位までを扱いたい場合は、Excelのセル書式設定を開き、「ユーザー定義」で次の形式を新規作成して適用します。書式を変更しないでコピーした場合は分までのデータとなり、スクリプトは00秒と認識します。
yyyy/mm/dd hh:mm:ss
約定日(A列)~約定単価(L列)までのデータ部分をコピーする。
※このとき、項目名(ヘッダー行)は含めず、データ部分のみをコピーしてください。項目名を含めるとスクリプトが誤認識してエラーになります
(3)メモ欄を作成する場合
約定単価の右隣の列(M列)を「メモ欄」として利用できます。ここにエントリー根拠など任意のメモを書いておくとラベル上でもメモを確認できます。
メモ欄を作成した場合は、約定日(A列)からメモ欄(M列)までをコピーして貼り付けてください。
※このとき、項目名(ヘッダー行)は含めず、データ部分のみをコピーしてください。項目名を含めるとスクリプトが誤認識してエラーになります。
2. データをTradingViewに貼り付ける
スクリプトの設定画面を開き、「取引データ貼り付け欄」にExcelからコピーしたデータをそのまま貼り付けます。
スクリプトが自動でテキストを解析し、日付・時刻・銘柄コード・取引区分・建玉区分・信用区分・数量・単価・メモなどを認識して、ラベルをチャート上に自動配置します。
複数銘柄のデータを一度に貼り付けても問題ありません。現在表示中のチャート銘柄と一致する行だけがラベルとして描画されます。
3. 表示設定(ON/OFF切り替え)
各表示要素(信用区分・建玉区分・数量・メモなど)は、設定画面のチェックボックス(input.bool)で個別に表示/非表示を切り替えられます。
メモ欄を作成している場合は、その内容もラベルに表示されます。
4. チャートでの確認
各取引のIN・OUTが、チャート上の該当バー(ローソク足)にラベルとして表示されます。
日足・分足を切り替えることで、より詳細なタイミングを確認できます。
ラベルは、買い(Buy)・売り(Sell)・返済などで色分けされ、視覚的に理解しやすい構成になっています。
チャートを銘柄ごとに切り替えるだけで、その銘柄の取引履歴のみが自動表示されます。
5. 注意点
このスクリプトは 1分足~日足 での使用を想定しています。データ上の日付や時刻に対応するローソク足が存在しない場合、ラベルを正しく表示できません。
データは手動貼り付け方式です。自動取得には対応していません。
Excel以外のアプリで開いたCSVは、文字列形式が変わるため解析できないことがあります。
Pineスクリプトの仕様上、テキストエリアには40,960文字までしか貼り付けできません。
楽天証券の出力フォーマットを想定しているため、他社形式を使う場合は列構成を揃える必要があります。
また、楽天証券の出力フォーマットが変更された場合は、正しく表示出来なります。
Информация о релизе
Additional NoteHow to Display Arbitrary Array Data as Labels at Specific Dates and Times
This script analyzes data pasted from Excel or similar sources and displays labels at any specified date, time, and price level on the chart.
The process works as follows:
Split by line breaks to separate each trade entry.
The pasted text is split by line breaks (\n), and each line is treated as a single trade record.
Split each line by tabs or commas to extract column data.
Data copied from Excel is usually tab-delimited, so each line is divided into columns using str.split(line, "\t").
Convert trade date and time into Pine Script timestamp format.
Strings in the format "yyyy/mm/dd hh:mm:ss" are parsed and converted using
timestamp("Asia/Tokyo", year, month, day, hour, minute, second).
Match timestamps with chart bars.
The converted timestamps are compared with the chart’s time values, and the bar that matches or is closest to the trade time is identified.
Generate labels at the corresponding bar and price position.
Labels are drawn at the Y-axis position corresponding to the trade price and the X-axis position corresponding to the trade timestamp.
Key Point:
By specifying the label’s X-coordinate using UNIX time (timestamp) instead of bar_index,
labels can be positioned freely at any date and time, independent of chart bars.
Profit and Loss Calculation
The script refers to the position type (e.g., cash, margin) in the imported array data
and calculates profit and loss independently for each category.
Cash trades are calculated separately from margin trades — they are never mixed.
Similarly, different margin types (e.g., institutional margin, general margin) are managed independently.
When multiple positions are accumulated, the average acquisition price is calculated and stored.
It is updated whenever partial executions or additional positions occur.
Upon closing a position, profit or loss is calculated using the stored average acquisition price.
For example, in the case of a buy position, profit/loss is calculated as:
Profit/Loss = (Sell Price − Average Cost) × Quantity
By clearly separating position types and maintaining the average acquisition price,
the script ensures accurate profit and loss calculations even for multiple positions or partial settlements.
補足説明
任意の配列データを任意の日付・時刻にラベル表示する方法
このスクリプトでは、Excelなどから貼り付けたデータを解析し、任意の日時・価格位置にラベルを表示できます。
処理の流れは次のとおりです。
改行で分割し、取引ごとに1行ずつに分ける。
貼り付けたテキストを改行(\n)で分割し、各行を1件の取引データとして扱います。
各行をタブまたはカンマで分割し、列データを抽出する。
Excelからコピーしたデータは通常タブ区切りのため、str.split(line, "\t")で列ごとに分解します。
約定日・時刻をPineスクリプトのタイムスタンプ形式に変換する。
「yyyy/mm/dd hh:mm:ss」形式の文字列を分解して、
timestamp("Asia/Tokyo", 年, 月, 日, 時, 分, 秒) に変換します。
チャート上のバーと時刻を照合する。
変換したタイムスタンプと、チャート上の各バーのtimeを比較し、
一致または最も近いバーを特定します。
該当バー上の価格位置にラベルを生成する。
取引価格に対応するY軸位置、約定時間に対応するX軸位置にラベルを表示します。
ポイント:
ラベルの横軸(X座標)をバーインデックス(bar_index)ではなく、UNIX時間(timestamp) で指定することで、
バーに依存せず任意の日時にラベルを配置することが可能になります。
損益計算の仕組み
スクリプトは、読み込んだ配列データの「建玉区分」を参照して、
各区分ごとに独立して損益を計算します。
現物取引は現物だけで計算され、信用取引とは混在しません。
同様に、制度信用・一般信用などの異なる区分も独立して管理されます。
複数の建玉を持つ場合、平均取得単価を計算して保持します。
部分約定や追加建玉が発生しても、平均単価を常に更新しておきます。
返済時(決済時)は平均取得単価を用いて損益を算出します。
たとえば、買建の場合の損益は以下の式で求めます:
損益 = (返済価格 - 平均取得単価) × 株数
このように、建玉区分を明確に分け、平均単価を管理することで、
複数玉や部分返済にも正確に対応した損益計算が可能になっています。
Скрипт с защищённым кодом
Этот скрипт опубликован с закрытым исходным кодом. Однако вы можете использовать его свободно и без каких-либо ограничений — читайте подробнее здесь.
Отказ от ответственности
Информация и публикации не предназначены для предоставления и не являются финансовыми, инвестиционными, торговыми или другими видами советов или рекомендаций, предоставленных или одобренных TradingView. Подробнее читайте в Условиях использования.