PROTECTED SOURCE SCRIPT
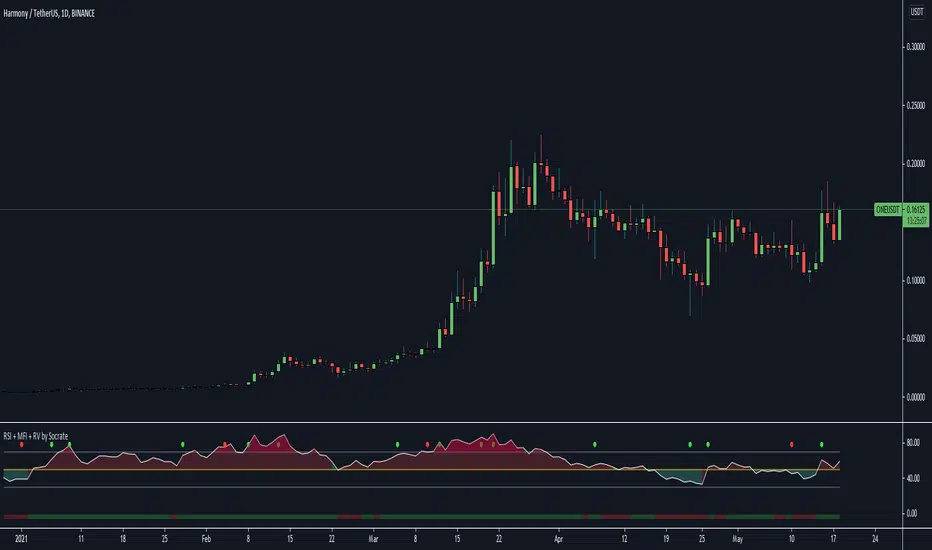
RSI , Money Flow Index, Anormal Relative Volume 3in1 indicator

https://www.tradingview.com/x/YKgp5rB8/
RSI , Money Flow Index and Anormal Relative Volume indicator.
How the indicator works ? You have dot's on the top to show you the anormal relative volumes (you can adjust it with the treshold), you have a classical RSI cloud wich give you an quick opinion about the trend momemtum strengh, and the bar on bottom gives you a quick hint on the actual moneyflow stream.
Inputs that you can setup :
- Source
- RSI Lenght
- Neutral level
- Overbought value
- Oversold value
- MFI Lengh
- RV length
- RV Period
- RV Treshold
- RV smoothing value
- RV Breakout Based on
!!!!!!!!!!!!!!!!!!!!!!!!!!
Remember, an oversold RSI doesn't mean you should BUY an asset, it means the momentum is week on the bull side, the same but opposit for Overbought ;)
!!!!!!!!!!!!!!!!!!!!!!!!!
Relative anormal volumes are a good hint on something is happening on an asset, remember, dont put the treshold too low, i recommended min value on 1.25 for stocks, min value 1.5/1.8 for crypto-currencies.
!!!!!!!!!!!!!!!!!!!!!!!!!
Have fun !
Скрипт с защищённым кодом
Этот скрипт опубликован с закрытым исходным кодом. Однако вы можете использовать его свободно и без каких-либо ограничений — читайте подробнее здесь.
Отказ от ответственности
Информация и публикации не предназначены для предоставления и не являются финансовыми, инвестиционными, торговыми или другими видами советов или рекомендаций, предоставленных или одобренных TradingView. Подробнее читайте в Условиях использования.