UTFS V2 | QR
What it is
UTFS V2 | QR is a rules-based trend system that blends three complementary engines into one Trend Probability Index (TPI) and executes long / flat positions directly in the Strategy Tester. It is designed to participate in sustained trends, stand aside during weak/hostile regimes, and present performance/diagnostics in a clean, self-contained chart.
How it works
UTFS V2 builds a single state (Bullish / Bearish / Neutral) from three independent components. Each module produces a +1 (bull), −1 (bear) or 0 (neutral) vote. The TPI is the average of the three votes, then compared to user thresholds for trade decisions.
- AVWO
Compares price to a volume-weighted moving average and measures the percentage deviation.
Uses a dynamic, volatility-scaled threshold (adaptive standard deviation with smoothing) so “over/under” signals expand/contract with regime.
Output: +1 when the positive deviation clears the adaptive upper band; −1 when it clears the lower band.
- ARSI Momentum Filter
Builds an adaptive baseline by blending price with an RSI-derived alpha, then evaluates the % distance from that baseline.
Again gates signals through dynamic, smoothed thresholds to suppress whipsaws.
Output: +1 above the upper adaptive band; −1 below the lower band.
-Median / Volatility Structure (VWMA-Median + ATR/SD)
Defines a trend median (percentile on VWMA) and checks price vs. the median using ATR and standard-deviation bands.
Confirms upside only when price expands beyond ATR and SD gates while VWMA is rising; flags downside when price loses the lower ATR gate.
Output: +1 on confirmed upside expansion; −1 on downside loss; else 0.
Aggregation → TPI
TPI = (AVWO + ARSI + Median/Vol) / 3.
Trade logic (Strategy):
If TPI > T_up → enter / hold Long.
If TPI < T_d → flat (close all).
Defaults: long/flat only (no net short), process orders on close, 1 tick slippage, position sizing as % of equity.
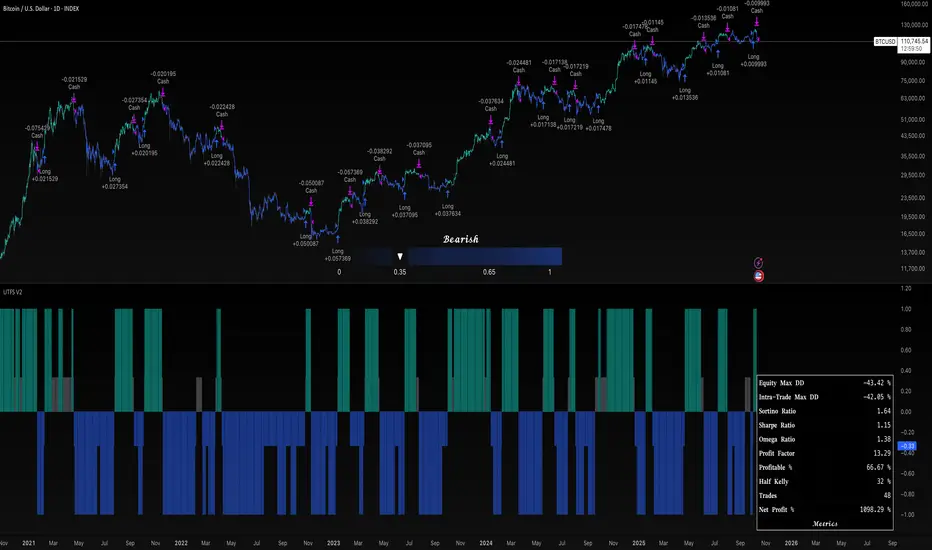
What you see on the chart
TPI Column Plot: green above T_up, red below T_d, gray in between.
Trend-Strength Gauge (table): live “Bullish / Bearish / Do nothing” banner with a compact bar gauge scaled from the normalized TPI.
Optional metrics table (via Rocheur/Metric import): equity curve/PL diagnostics for audit in a clean layout.
Clean layout: the script is self-contained; no other indicators are required to understand or use it.
Visuals
Color mode; show/hide table; display curve selection (equity/open/gross/net) from Metrics.
Backtest window
start / end times to restrict the sample tested.
How to use it (practical workflow)
Timeframe: start on higher timeframes (e.g., 4H/D/W) to reduce noise; then adapt.
Regime filter: respect Neutral (gray) by not forcing trades between thresholds.
Execution: by default the strategy goes Long when TPI is convincingly positive and moves to Cash when negative. If you require hedging/shorts, keep them separate to preserve the system’s logic.
Risk: thresholds control aggressiveness; wider bands (higher multipliers / longer periods) → fewer, more selective trades.
Originality & value (why this is worth using)
Tri-engine consensus: price-to-VWMA deviation (with volume context), RSI-adaptive baseline momentum, and structure/volatility confirmation must agree before exposure.
Regime-aware thresholds: all modules use volatility-scaled, smoothed gates, not fixed lines. This maintains comparability across quiet and hectic markets.
Clean deployment: a single self-contained script renders signal, strength and performance without external charts or links, suitable for a clean publication chart as required.
Limitations & good practices
No strategy is universal; extreme trend persistence can keep TPI pinned, and chop can still produce false starts if you set very tight thresholds.
Inputs are instrument/timeframe-sensitive. Always re-opt for the asset and horizon you trade, and validate on an out-of-sample period.
The built-in position sizing is simple % of equity; match it to your portfolio rules.
Chart-publishing guidance
Publish with a clean chart (avoid stacking other indicators unless necessary).
If you include drawings, use them only to explain how to read TPI thresholds or where a module changed state.
Disclaimer
This script is for research and education only and does not constitute financial advice. Markets involve risk, including loss of principal. Past performance does not predict or guarantee future results. Always test settings on your instrument/timeframe and use appropriate risk management.
Скрипт с ограниченным доступом
Только пользователи, одобренные автором, могут получить доступ к этому скрипту. Вам нужно отправить запрос и получить разрешение на его использование. Обычно доступ предоставляется после оплаты. Для получения подробной информации следуйте инструкциям автора ниже или свяжитесь с QuantumResearch напрямую.
TradingView НЕ рекомендует платить за скрипт или использовать его, если вы не доверяете его автору и не понимаете, как скрипт работает. Вы всегда можете найти бесплатные скрипты с открытым исходным кодом в Скриптах сообщества.
Инструкции от автора
whop.com/quantum-whop/
⚒️ Get access to our toolbox here for free:
quantumresearchportfolio.carrd.co
All tools and content provided are for informational and educational purposes only.
Отказ от ответственности
Скрипт с ограниченным доступом
Только пользователи, одобренные автором, могут получить доступ к этому скрипту. Вам нужно отправить запрос и получить разрешение на его использование. Обычно доступ предоставляется после оплаты. Для получения подробной информации следуйте инструкциям автора ниже или свяжитесь с QuantumResearch напрямую.
TradingView НЕ рекомендует платить за скрипт или использовать его, если вы не доверяете его автору и не понимаете, как скрипт работает. Вы всегда можете найти бесплатные скрипты с открытым исходным кодом в Скриптах сообщества.
Инструкции от автора
whop.com/quantum-whop/
⚒️ Get access to our toolbox here for free:
quantumresearchportfolio.carrd.co
All tools and content provided are for informational and educational purposes only.