OPEN-SOURCE SCRIPT
Dollar Volume Last 20 Candles

The "Dollar Volume Last 20 Candles" indicator, abbreviated as "DV", is a practical and insightful tool for traders and analysts.
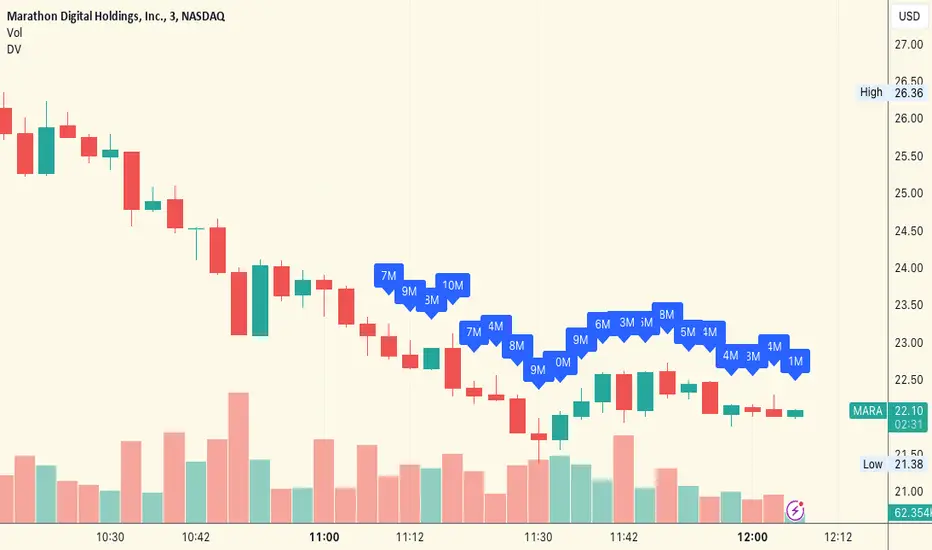
This indicator focuses on enhancing the visualization of trading data by calculating and displaying the dollar volume for each of the last 20 bars on a financial chart. It achieves this by multiplying the closing price of each bar with its trading volume, providing a clear dollar value of the trading activity.
The script also features an intuitive formatting system that simplifies large numbers into 'k' (thousands) and 'M' (millions), making the data easily digestible.
The dollar volume data is displayed directly above each bar, adjusted for visibility using the Average True Range (ATR), ensuring that it is both unobtrusive and readily accessible. This overlay feature integrates seamlessly with the existing chart, offering traders a quick and efficient way to assess monetary trading volume at a glance, which is particularly useful for identifying trends and market strength.
Скрипт с открытым кодом
В истинном духе TradingView, создатель этого скрипта сделал его открытым исходным кодом, чтобы трейдеры могли проверить и убедиться в его функциональности. Браво автору! Вы можете использовать его бесплатно, но помните, что перепубликация кода подчиняется нашим Правилам поведения.
Отказ от ответственности
Информация и публикации не предназначены для предоставления и не являются финансовыми, инвестиционными, торговыми или другими видами советов или рекомендаций, предоставленных или одобренных TradingView. Подробнее читайте в Условиях использования.