TradeMate - Trend Tamer

The TradeMate Trend Tamer is designed to help traders identify potential trend reversals and navigate periods of high market volatility. This tool combines a custom EMA-based oscillator with a volatility detection mechanism, providing traders with actionable signals that are easy to interpret and apply.
🔶 Originality and Utility
The TradeMate Trend Tamer is not just a mashup of indicators but a well-integrated system that enhances the reliability of trend detection. The core of this indicator is a custom EMA calculation that identifies trend shifts based on price momentum and directional changes. This EMA is further enhanced by a volatility detection system that colors bars yellow during periods of high volatility, indicating potential market reversals.
The indicator is particularly useful for traders who are looking for clear and straightforward signals to identify buying and selling opportunities, especially in volatile markets where traditional indicators might produce false signals. By combining trend arrows with volatility signals, the TradeMate Trend Tamer helps traders confirm the strength of a signal and avoid getting caught in market noise.
🔶 Description and Underlying Logic
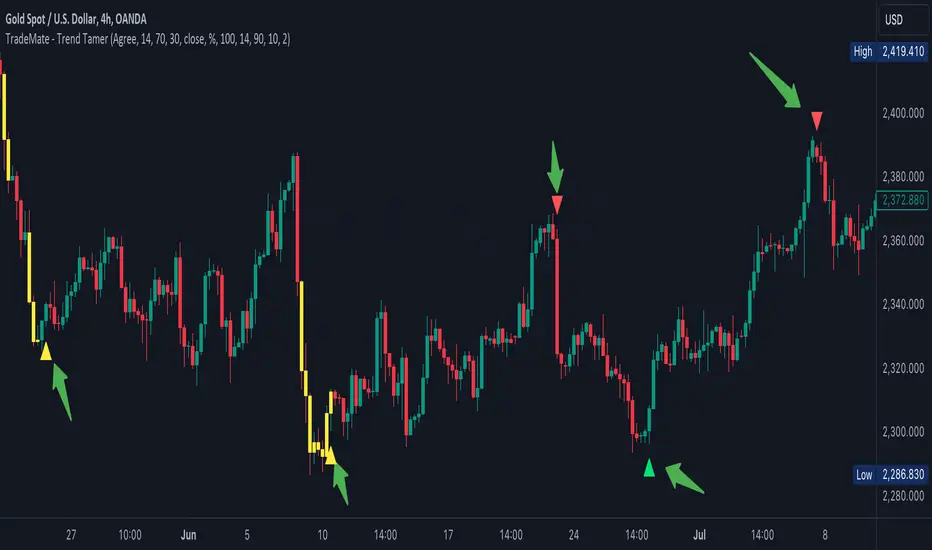
The TradeMate Trend Tamer uses a custom EMA calculation that smooths price movements to detect significant shifts in momentum. This EMA is plotted on the chart and is complemented by arrows indicating potential buy or sell signals:
Upward Arrows: These appear when the EMA indicates an upward momentum shift, suggesting a potential buying opportunity.
Downward Arrows: These indicate a downward momentum shift, signaling a potential selling opportunity.
The volatility detection mechanism works by analyzing the ATR (Average True Range) over a specified lookback period. The indicator identifies extreme volatility zones where the ATR exceeds a certain threshold, coloring the bars yellow to visually alert traders. This helps traders identify when the market is more likely to reverse, making the combination of trend arrows and volatility signals a powerful tool for decision-making.
🔶 Using the TradeMate Trend Tamer
Traders should use the trend arrows as an initial signal and confirm it with the yellow-colored volatility bars. For example:
High Volatility with Upward Arrow: Indicates a strong buy signal as the market is likely to reverse upwards.
High Volatility with Downward Arrow: Indicates a strong sell signal, suggesting a potential downward reversal.
By following these signals, traders can enhance their entry and exit strategies, especially in markets prone to sudden moves.
Скрипт с ограниченным доступом
Доступ к этому скрипту имеют только пользователи, одобренные автором. Вам необходимо запросить и получить разрешение на его использование. Обычно оно предоставляется после оплаты. Для получения подробной информации следуйте инструкциям автора ниже или свяжитесь напрямую с Morpheus_Trading_Suite.
TradingView НЕ рекомендует оплачивать или использовать скрипт, если вы полностью не доверяете его автору и не понимаете, как он работает. Вы также можете найти бесплатные, открытые альтернативы в наших скриптах сообщества.
Инструкции от автора
Отказ от ответственности
Скрипт с ограниченным доступом
Доступ к этому скрипту имеют только пользователи, одобренные автором. Вам необходимо запросить и получить разрешение на его использование. Обычно оно предоставляется после оплаты. Для получения подробной информации следуйте инструкциям автора ниже или свяжитесь напрямую с Morpheus_Trading_Suite.
TradingView НЕ рекомендует оплачивать или использовать скрипт, если вы полностью не доверяете его автору и не понимаете, как он работает. Вы также можете найти бесплатные, открытые альтернативы в наших скриптах сообщества.