PROTECTED SOURCE SCRIPT
PPO+Stoch_MTM
PPO + Stoch_MTM (SMI) — Description
Version: Pine v6
What this indicator does
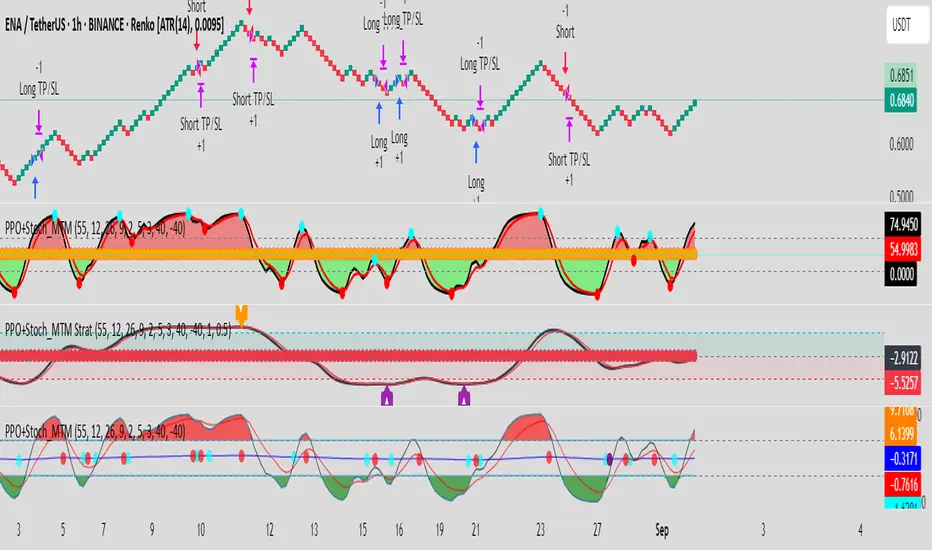
Computes a PPO (Percentage Price Oscillator) and a smoothed SMI-like stochastic (Stoch_MTM), plots both and their signals in one pane.
Shows histogram of PPO momentum (PPO − PPO signal), SMI (K) and SMI signal (D).
Detects and marks simple bullish / bearish divergences on SMI and PPO (visual lines + markers).
Draws SMI pivot tops / bottoms (small crosses) for structure reference.
Optionally fills the area above/below zero for quick buy/sell zone visualization.
Default inputs (exposed)
Use long term Divergences? = true
Lookback Period = 55
PPO: Fast Length = 12, Slow Length = 26, Signal Length = 9, Smoother = 2
SMI: Percent K Length = 5, Percent D Length = 3
Overbought = 40, Oversold = −40
Toggle options: show/hide PPO plots, SMI plots, divergences, pivots, and SMI zone fill
Plots & visuals
PPO (line), PPO signal (line), PPO histogram (columns)
SMI K (black line) and SMI D (red line)
Overbought / Oversold levels (dashed lines) and zero line (dotted)
Colored semi-transparent fill: green when SMI > 0, red when SMI < 0 (optional)
Divergence lines: purple for bullish, orange for bearish (drawn between indicator swings)
Markers: small labeled shapes for BUY / SELL triggers (basic cross confirmations)
Buy / Sell signal logic (default example)
Buy: PPO histogram > 0 and SMI crosses above SMI signal (simple confirmation)
Sell: PPO histogram < 0 and SMI crosses below SMI signal
Divergences and pivots are visual aids — combine with price action and risk rules.
How to use (practical notes)
Use longer timeframes or appropriately sized Renko bricks for reduced whipsaw; this indicator is an oscillator, not a standalone order system.
Treat divergence lines as early warning / context — validate with price structure (higher highs / lower lows).
Use the show/hide toggles to declutter the pane depending on your workflow.
Add alerts on the BUY/SELL signal shapes or custom alertcondition(...) if you want push/WebHook alerts.
Limitations & risks
Not a guarantee of profitability — oscillators produce false signals in strong trends or during low liquidity.
Divergence detection is simplified to be robust and fast; proprietary divergence engines may behave differently.
Backtest any rule set before live trading; apply position sizing and risk controls.
Recommended quick start
Add indicator to chart with defaults.
Test visually on 1H / 4H (or Renko charts scaled to ATR-based brick) to see signal behaviour.
Use PPO histogram + SMI K/D cross for entry signals; require price structure confirmation for trade entry.
Add stop-loss (recent swing low/high) and fixed risk per trade (e.g., 0.25–1% equity).
Version: Pine v6
What this indicator does
Computes a PPO (Percentage Price Oscillator) and a smoothed SMI-like stochastic (Stoch_MTM), plots both and their signals in one pane.
Shows histogram of PPO momentum (PPO − PPO signal), SMI (K) and SMI signal (D).
Detects and marks simple bullish / bearish divergences on SMI and PPO (visual lines + markers).
Draws SMI pivot tops / bottoms (small crosses) for structure reference.
Optionally fills the area above/below zero for quick buy/sell zone visualization.
Default inputs (exposed)
Use long term Divergences? = true
Lookback Period = 55
PPO: Fast Length = 12, Slow Length = 26, Signal Length = 9, Smoother = 2
SMI: Percent K Length = 5, Percent D Length = 3
Overbought = 40, Oversold = −40
Toggle options: show/hide PPO plots, SMI plots, divergences, pivots, and SMI zone fill
Plots & visuals
PPO (line), PPO signal (line), PPO histogram (columns)
SMI K (black line) and SMI D (red line)
Overbought / Oversold levels (dashed lines) and zero line (dotted)
Colored semi-transparent fill: green when SMI > 0, red when SMI < 0 (optional)
Divergence lines: purple for bullish, orange for bearish (drawn between indicator swings)
Markers: small labeled shapes for BUY / SELL triggers (basic cross confirmations)
Buy / Sell signal logic (default example)
Buy: PPO histogram > 0 and SMI crosses above SMI signal (simple confirmation)
Sell: PPO histogram < 0 and SMI crosses below SMI signal
Divergences and pivots are visual aids — combine with price action and risk rules.
How to use (practical notes)
Use longer timeframes or appropriately sized Renko bricks for reduced whipsaw; this indicator is an oscillator, not a standalone order system.
Treat divergence lines as early warning / context — validate with price structure (higher highs / lower lows).
Use the show/hide toggles to declutter the pane depending on your workflow.
Add alerts on the BUY/SELL signal shapes or custom alertcondition(...) if you want push/WebHook alerts.
Limitations & risks
Not a guarantee of profitability — oscillators produce false signals in strong trends or during low liquidity.
Divergence detection is simplified to be robust and fast; proprietary divergence engines may behave differently.
Backtest any rule set before live trading; apply position sizing and risk controls.
Recommended quick start
Add indicator to chart with defaults.
Test visually on 1H / 4H (or Renko charts scaled to ATR-based brick) to see signal behaviour.
Use PPO histogram + SMI K/D cross for entry signals; require price structure confirmation for trade entry.
Add stop-loss (recent swing low/high) and fixed risk per trade (e.g., 0.25–1% equity).
Скрипт с защищённым кодом
Этот скрипт опубликован с закрытым исходным кодом. Однако вы можете использовать его свободно и без каких-либо ограничений — читайте подробнее здесь.
Отказ от ответственности
Все виды контента, которые вы можете увидеть на TradingView, не являются финансовыми, инвестиционными, торговыми или любыми другими рекомендациями. Мы не предоставляем советы по покупке и продаже активов. Подробнее — в Условиях использования TradingView.