PROTECTED SOURCE SCRIPT
Islamic Tijarat -Dual Relative Strength
Islamic Tijarat - Dual Relative Strength
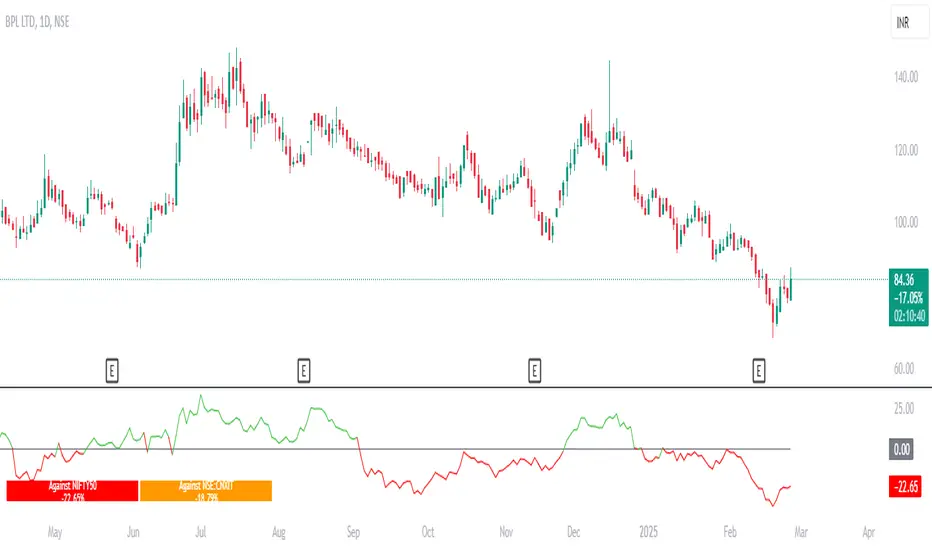
Islamic Tijarat - Dual Relative Strength is a powerful indicator designed to compare the relative performance of two securities, such as a stock against its sector index or Nifty 50 (default benchmark) . This helps traders assess whether a stock is outperforming (> 0) or underperforming (< 0) relative to the chosen benchmark.
Key Features:
✔ Relative Strength Comparison – Measure the performance of a stock relative to Nifty 50, industry index, or sector index.
✔ Multiple Timeframes – Works best on Daily Timeframe (TF) but can also be applied to Weekly, Monthly, or Intraday charts based on the preferred calculation period.
✔ Customizable Calculation Period – Choose the desired number of hours when applying it to smaller timeframes.
✔ Box Table Display – Provides a clear performance comparison against both Nifty 50 and the selected sector index .
✔ Toggle Color Option on Crossovers – Visually highlights significant crossovers in relative strength for better readability.
✔ Enhanced Label Display – Fixed label visibility issue when plot options were disabled.
✔ Superimposed Price Action on RS Line – In addition to standard Relative Strength (RS) behavior, users can now overlay price action movements onto the RS line for a more holistic analysis.
✔ Customizable Moving Averages for RS – Added SMA/EMA (length: 9) to smoothen the RS calculation, helping traders filter noise and identify trends more effectively.
Usage:
✅ Compare stock performance against Nifty 50 , industry index, sector index, or any other security within the same sector.
✅ Identify strength and weakness trends over different timeframes.
✅ Use crossovers, trend direction, and price action integration for better decision-making.
This brings enhanced functionality, improved visualization, and bug fixes, making it a must-have tool for traders focusing on relative strength analysis.
Скрипт с защищённым кодом
Этот скрипт опубликован с закрытым исходным кодом. Однако вы можете использовать его свободно и без каких-либо ограничений — читайте подробнее здесь.
Regards
SuperChartz
telegram.me/SuperChartz
Instagram.com/SuperChartz
facebook.com/SuperChartz
twitter.com/SuperChartz
youtube.com/@SuperChart
Get TradingView Premium 👇
in.tradingview.com/?aff_id=130166
SuperChartz
telegram.me/SuperChartz
Instagram.com/SuperChartz
facebook.com/SuperChartz
twitter.com/SuperChartz
youtube.com/@SuperChart
Get TradingView Premium 👇
in.tradingview.com/?aff_id=130166
Отказ от ответственности
Информация и публикации не предназначены для предоставления и не являются финансовыми, инвестиционными, торговыми или другими видами советов или рекомендаций, предоставленных или одобренных TradingView. Подробнее читайте в Условиях использования.