PROTECTED SOURCE SCRIPT
Обновлено wedges and flags
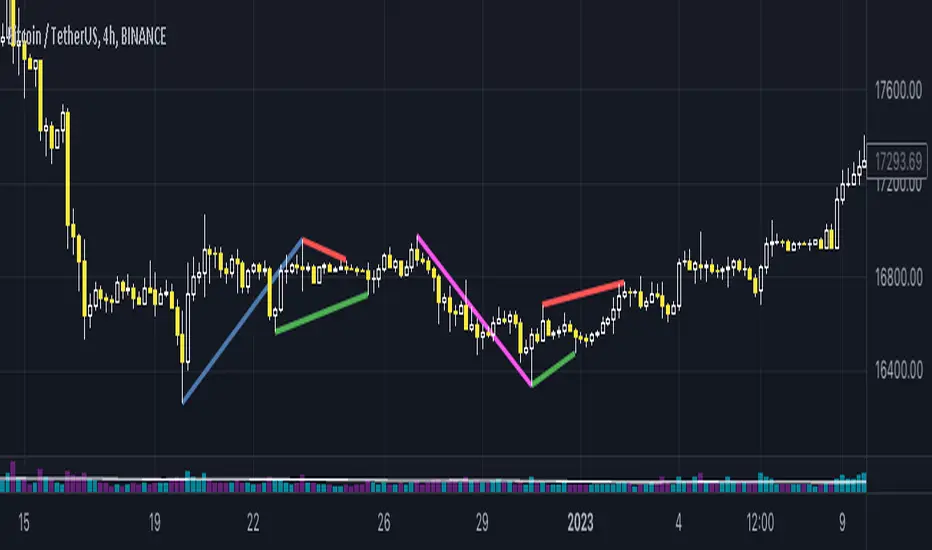
This script identifies chart patterns: wedges, flags, triangles on the chart
It has many settings. You can choose by which extremums you want to identify patterns - by the edges of wicks (tails, shadows), or by the edges of candle bodies.
You can also adjust the accuracy - how smooth and accurate the shapes must be in order for them to be considered wedges or triangles.
You can also customize other parameters of the figure, for example, how long the flagpole should be in order to consider such a figure a wedge, a flag or a triangle.
You can also set how large the allowable spread of candles relative to the flagpole can be.
The Sensitivity parameter - will allow you to control the number of patterns detected depending on whether you want the patterns to be detected more often, or if they cover more candles and thus be more reliable
You can also customize your styles.
All key settings are accompanied by tooltips
Информация о релизе
Corrected wordingСкрипт с защищённым кодом
Этот скрипт опубликован с закрытым исходным кодом. Однако вы можете использовать его свободно и без каких-либо ограничений — читайте подробнее здесь.
Отказ от ответственности
Информация и публикации не предназначены для предоставления и не являются финансовыми, инвестиционными, торговыми или другими видами советов или рекомендаций, предоставленных или одобренных TradingView. Подробнее читайте в Условиях использования.
Скрипт с защищённым кодом
Этот скрипт опубликован с закрытым исходным кодом. Однако вы можете использовать его свободно и без каких-либо ограничений — читайте подробнее здесь.
Отказ от ответственности
Информация и публикации не предназначены для предоставления и не являются финансовыми, инвестиционными, торговыми или другими видами советов или рекомендаций, предоставленных или одобренных TradingView. Подробнее читайте в Условиях использования.