OPEN-SOURCE SCRIPT
Обновлено Ultimate Relative Strength
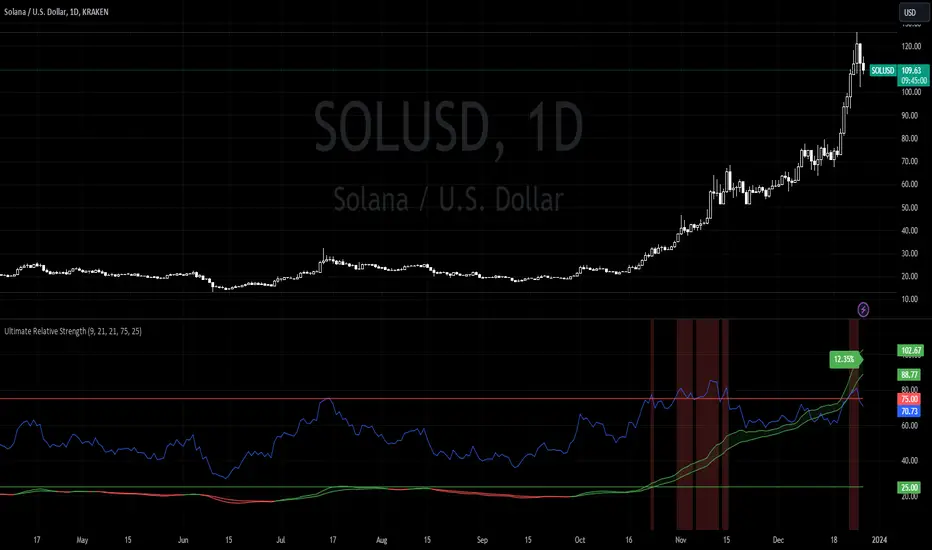
Ema 9 and 21 crossover bands. Green for positive trend, red for negative. It then calculates the distance between the bands and plots the distance as a percentage compared to the overall asset price.
Relative strength index with overbought and oversold levels (customizable). Green columns could be a good place to DCA. Red columns for marking local tops.
By recording the RS % amongst a list of assets, you can determine Salxx's RS Ranking from highest to lowest. A high ranking % inside a red column suggests short term dip or sideways movement. Not the best time to buy in. Monitor until consolidation between overbought and oversold levels. If RS ranking still high, now time to buy in.
Информация о релизе
..Информация о релизе
.Скрипт с открытым кодом
В истинном духе TradingView, создатель этого скрипта сделал его открытым исходным кодом, чтобы трейдеры могли проверить и убедиться в его функциональности. Браво автору! Вы можете использовать его бесплатно, но помните, что перепубликация кода подчиняется нашим Правилам поведения.
Отказ от ответственности
Информация и публикации не предназначены для предоставления и не являются финансовыми, инвестиционными, торговыми или другими видами советов или рекомендаций, предоставленных или одобренных TradingView. Подробнее читайте в Условиях использования.
Скрипт с открытым кодом
В истинном духе TradingView, создатель этого скрипта сделал его открытым исходным кодом, чтобы трейдеры могли проверить и убедиться в его функциональности. Браво автору! Вы можете использовать его бесплатно, но помните, что перепубликация кода подчиняется нашим Правилам поведения.
Отказ от ответственности
Информация и публикации не предназначены для предоставления и не являются финансовыми, инвестиционными, торговыми или другими видами советов или рекомендаций, предоставленных или одобренных TradingView. Подробнее читайте в Условиях использования.