OPEN-SOURCE SCRIPT
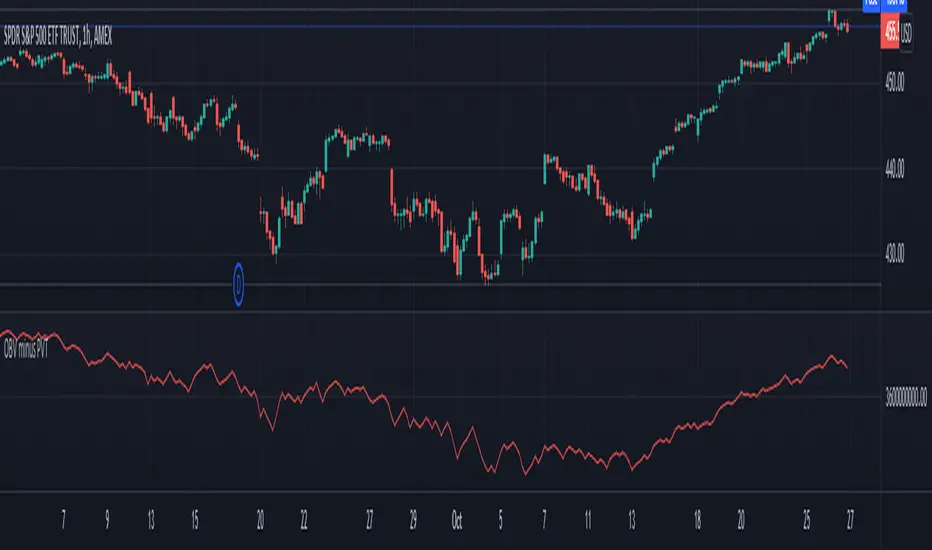
Volume Difference Indicator

This indicator is a simple volume difference indicator.
How it works:
First we calculate the on balance volume, and then we calculate the price volume trend.
For those unaware, the OBV subtracts all volumes when price records a lower close and adds them in the case of a higher price close. In contrast, PVT subtracts or adds only a proportion of the volume from its cumulative total in relation to a percentage change in price.
Using this knowledge, we are using the difference of OBV (the indicator with the entire amount added or subtracted), minus PVT (which subtracts a percent based on the percentage in price), this gives us a unique indicator which out puts a more whole picture of the two indicators. It shows us the difference of absolute volume minus relative volume based on the percent of close price. It allows us to see large shifts in volume BEFORE it happens.
How to use this indicator:
When there is a sharp increase of Volume Difference Indicator, but close has NOT risen, price tends to rise immediately following this. When the Volume Difference Indicator drops, but price has NOT changed, price tends to fall immediately following this.
Скрипт с открытым кодом
В истинном духе TradingView, создатель этого скрипта сделал его открытым исходным кодом, чтобы трейдеры могли проверить и убедиться в его функциональности. Браво автору! Вы можете использовать его бесплатно, но помните, что перепубликация кода подчиняется нашим Правилам поведения.
Отказ от ответственности
Информация и публикации не предназначены для предоставления и не являются финансовыми, инвестиционными, торговыми или другими видами советов или рекомендаций, предоставленных или одобренных TradingView. Подробнее читайте в Условиях использования.