OPEN-SOURCE SCRIPT
Обновлено CF Cycle Low Projection V2
Overview
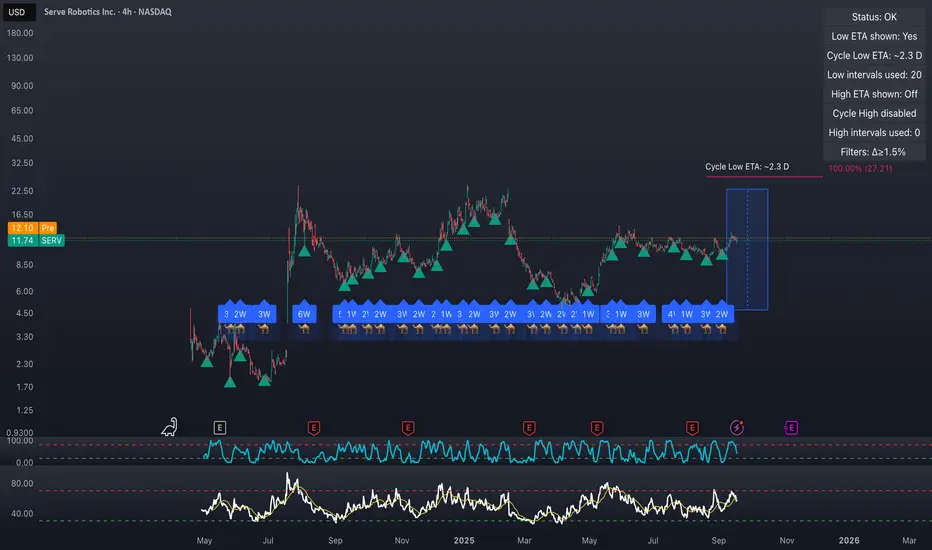
This indicator helps traders analyze repeating market cycles by detecting significant pivot lows and projecting when the next cycle low may occur. It provides timing context to support decision-making but does not generate direct buy/sell signals.
How it works
*Pivot detection: Confirms swing lows using left/right bars. Filters (minimum % move and optional ATR separation) ensure only meaningful lows are counted.
*
*Cycle averaging: Calculates the average interval (and standard deviation) between recent pivot lows.
*
*Projection: Adds the average interval to the last pivot low to forecast the next potential cycle low. If that point lies in the past, the script rolls forward until the projection is in the future.
*
*Timing window: A shaded area around the ETA is drawn, based on either standard deviation or a percentage of the average, showing when a low is statistically more likely to occur.
*Visualization:
*
*
• Vertical line = projected cycle low
• Shaded box = timing window
• Label = countdown in weeks/days/hours
• HUD = status, ETA, intervals used
How to use
Notes
This indicator helps traders analyze repeating market cycles by detecting significant pivot lows and projecting when the next cycle low may occur. It provides timing context to support decision-making but does not generate direct buy/sell signals.
How it works
*Pivot detection: Confirms swing lows using left/right bars. Filters (minimum % move and optional ATR separation) ensure only meaningful lows are counted.
*
*Cycle averaging: Calculates the average interval (and standard deviation) between recent pivot lows.
*
*Projection: Adds the average interval to the last pivot low to forecast the next potential cycle low. If that point lies in the past, the script rolls forward until the projection is in the future.
*
*Timing window: A shaded area around the ETA is drawn, based on either standard deviation or a percentage of the average, showing when a low is statistically more likely to occur.
*Visualization:
*
*
• Vertical line = projected cycle low
• Shaded box = timing window
• Label = countdown in weeks/days/hours
• HUD = status, ETA, intervals used
How to use
- Select your preferred timeframe (works on intraday and higher).
- Allow pivots to accumulate; once the HUD shows Status: OK, projections will appear.
- Use the ETA line and timing window together with structure, liquidity levels, and support/resistance zones.
- Combine with your own strategy and risk management rules.
Notes
- Works on any market supported by TradingView (crypto, stocks, forex, indices).
- Filters can be adjusted to reduce noise (e.g., increase % move or ATR multiplier).
- This tool is designed for cycle timing analysis only. It does not predict exact prices or guarantee outcomes.
- Some traders refer to this approach as “camel cycle trading,” but here it is implemented as a pivot-based cycle projection tool.
Информация о релизе
OverviewThis indicator helps traders analyze repeating market cycles by detecting significant pivot lows and projecting when the next cycle low may occur. It provides timing context to support decision-making but does not generate direct buy/sell signals.
How it works
- Pivot detection: Confirms swing lows using left/right bars. Filters (minimum % move and optional ATR separation) ensure only meaningful lows are counted.
- Cycle averaging: Calculates the average interval (and standard deviation) between recent pivot lows.
- Projection: Adds the average interval to the last pivot low to forecast the next potential cycle low. If that point lies in the past, the script rolls forward until the projection is in the future.
- Timing window: A shaded area around the ETA is drawn, based on either standard deviation or a percentage of the average, showing when a low is statistically more likely to occur.
- Visualization:
• Vertical line = projected cycle low
• Shaded box = timing window
• Label = countdown in weeks/days/hours
• HUD = status, ETA, intervals used
How to use
- Select your preferred timeframe (works on intraday and higher).
- Allow pivots to accumulate; once the HUD shows Status: OK, projections will appear.
- Use the ETA line and timing window together with structure, liquidity levels, and support/resistance zones.
- Combine with your own strategy and risk management rules.
Notes
- Works on any market supported by TradingView (crypto, stocks, forex, indices).
- Filters can be adjusted to reduce noise (e.g., increase % move or ATR multiplier).
- This tool is designed for cycle timing analysis only. It does not predict exact prices or guarantee outcomes.
- Some traders refer to this approach as “camel cycle trading,” but here it is implemented as a pivot-based cycle projection tool.
Информация о релизе
⚙️ OverviewThis indicator projects recurring market cycles by detecting significant pivot lows (and optionally highs) and estimating when the next cycle may occur. It provides timing context, not direct buy/sell signals.
💡 How it works
• Pivot detection: Identifies swing lows/highs using configurable left/right bar counts. Filters such as minimum % move, ATR separation, and a minimum bar gap ensure only meaningful pivots are counted.
• Cycle averaging: Measures intervals between pivots and calculates the average and standard deviation.
• Projection: Adds the average interval to the last pivot to forecast the next likely cycle timing. A shaded window is drawn around the ETA based on either a standard-deviation multiplier or a % of the average.
• Visualization:
– Vertical lines + shaded boxes = projected windows
– ETA labels = human-readable countdowns
– Red/green triangles = pivot markers anchored to candles
– Camel row = optional extra showing cycle length in weeks (text above, icon below)
– HUD = status, ETAs, intervals, and filter info
🧭 How to use
• By default, cycle-low projection is enabled. To project highs, toggle Cycle High Projection in the settings.
• Allow pivots to accumulate; the HUD will show “OK” once enough points exist to project.
• Use the projected ETAs as timing context alongside your own strategy (support/resistance, liquidity, structure).
• Adjust filters (Min % change, ATR multiplier) to reduce noise and focus on more meaningful cycles.
📝 Notes
• Works on all markets supported by TradingView (crypto, stocks, forex, indices).
• This script projects time only — it does not forecast price levels or guarantee outcomes.
• Alerts are included when price enters the projected windows.
• HUD, camel row, or projections can be toggled individually.
Информация о релизе
Updated descriptionСкрипт с открытым кодом
В истинном духе TradingView автор этого скрипта опубликовал его с открытым исходным кодом, чтобы трейдеры могли понять, как он работает, и проверить на практике. Вы можете воспользоваться им бесплатно, но повторное использование этого кода в публикации регулируется Правилами поведения.
Analyze any chart with AI: tradingwizard.ai
Отказ от ответственности
Все виды контента, которые вы можете увидеть на TradingView, не являются финансовыми, инвестиционными, торговыми или любыми другими рекомендациями. Мы не предоставляем советы по покупке и продаже активов. Подробнее — в Условиях использования TradingView.
Скрипт с открытым кодом
В истинном духе TradingView автор этого скрипта опубликовал его с открытым исходным кодом, чтобы трейдеры могли понять, как он работает, и проверить на практике. Вы можете воспользоваться им бесплатно, но повторное использование этого кода в публикации регулируется Правилами поведения.
Analyze any chart with AI: tradingwizard.ai
Отказ от ответственности
Все виды контента, которые вы можете увидеть на TradingView, не являются финансовыми, инвестиционными, торговыми или любыми другими рекомендациями. Мы не предоставляем советы по покупке и продаже активов. Подробнее — в Условиях использования TradingView.