OPEN-SOURCE SCRIPT
HH LL HL LH Marker
Обновлено
HH LL HL LH Marker
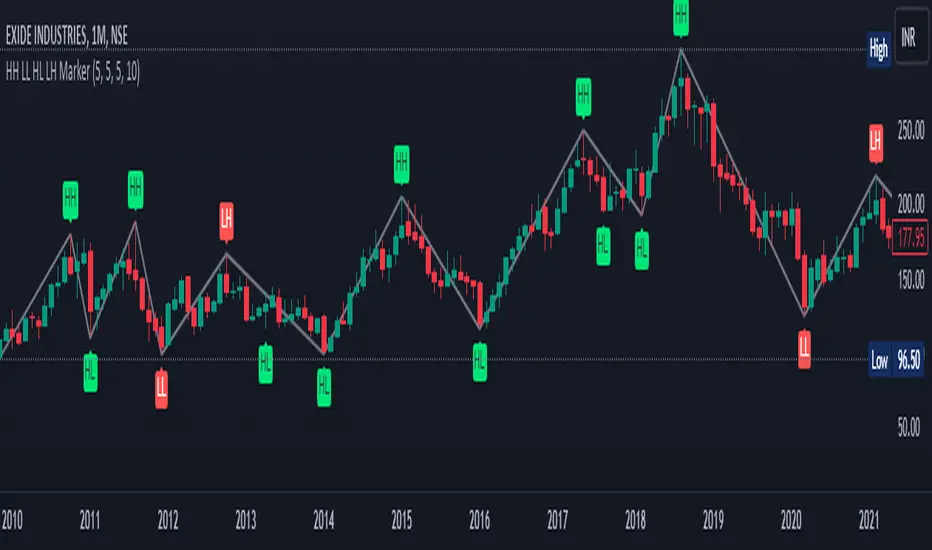
The "HH LL HL LH Marker" is a versatile technical analysis tool designed to help traders identify and visualize key pivot points in price action. It highlights four types of pivot points: Higher High (HH), Lower Low (LL), Higher Low (HL), and Lower High (LH), aiding in spotting potential trend reversals or continuations.
Features:
Customizable Inputs: Adjust the number of bars to look back on for pivot calculation, and choose which pivot types to display.
ZigZag Line: Optionally display a ZigZag line connecting the identified pivot points for a clearer visualization of price swings.
Visual Marker: Each pivot point type is marked with a distinct label, making it easy to identify on the chart.
How to Use:
Higher High (HH): Indicates when the current high is higher than the previous two highs, suggesting potential upward momentum.
Lower Low (LL): Signals when the current low is lower than the previous two lows, indicating potential downward momentum.
Higher Low (HL): Marks a higher low compared to the two previous lows, potentially signaling a bullish trend reversal.
Lower High (LH): Identifies a lower high compared to the two previous highs, potentially indicating a bearish trend reversal.
Usage Tips:
Combine with other technical indicators or chart patterns for comprehensive analysis.
Adjust input parameters according to the timeframe and asset being traded for optimal performance.
Note: This indicator is for educational purposes only and should be used alongside other tools and analysis techniques for making informed trading decisions.
Информация о релизе
HH LL HL LH MarkerThe "HH LL HL LH Marker" is a versatile technical analysis tool designed to help traders identify and visualize key pivot points in price action. It highlights four types of pivot points: Higher High (HH), Lower Low (LL), Higher Low (HL), and Lower High (LH), aiding in spotting potential trend reversals or continuations.
Features:
Customizable Inputs: Adjust the number of bars to look back on for pivot calculation, and choose which pivot types to display.
Visual Marker: Each pivot point type is marked with a distinct label, making it easy to identify on the chart.
ZigZag Line: Optionally display a ZigZag line connecting the identified pivot points for a clearer visualization of price swings.
How to Use:
Higher High (HH): Indicates when the current high is higher than the previous two highs, suggesting potential upward momentum.
Lower Low (LL): Signals when the current low is lower than the previous two lows, indicating potential downward momentum.
Higher Low (HL): Marks a higher low compared to the two previous lows, potentially signaling a bullish trend reversal.
Lower High (LH): Identifies a lower high compared to the two previous highs, potentially indicating a bearish trend reversal.
Usage Tips:
Combine with other technical indicators or chart patterns for comprehensive analysis.
Adjust input parameters according to the timeframe and asset being traded for optimal performance.
Note: This indicator is for educational purposes only and should be used alongside other tools and analysis techniques for making informed trading decisions.
Информация о релизе
The "HH LL HL LH Marker" is a versatile technical analysis tool designed to help traders identify and visualize key pivot points in price action. It highlights four types of pivot points: Higher High (HH), Lower Low (LL), Higher Low (HL), and Lower High (LH), aiding in spotting potential trend reversals or continuations.Features:
ZigZag Line: Optionally display a ZigZag line connecting the identified pivot points for a clearer visualization of price swings.
Customizable Inputs: Adjust the number of bars to look back on for pivot calculation, and choose which pivot types to display.
Visual Marker: Each pivot point type is marked with a distinct label, making it easy to identify on the chart.
How to Use:
Higher High (HH): Indicates when the current high is higher than the previous two highs, suggesting potential upward momentum.
Lower Low (LL): Signals when the current low is lower than the previous two lows, indicating potential downward momentum.
Higher Low (HL): Marks a higher low compared to the two previous lows, potentially signaling a bullish trend reversal.
Lower High (LH): Identifies a lower high compared to the two previous highs, potentially indicating a bearish trend reversal.
Usage Tips:
Combine with other technical indicators or chart patterns for comprehensive analysis.
Adjust input parameters according to the timeframe and asset being traded for optimal performance.
Note: This indicator is for educational purposes only and should be used alongside other tools and analysis techniques for making informed trading decisions.
Информация о релизе
Update : 1. Extend to last bar is turned off by default
2. Display reversal price is turned on by default
Информация о релизе
Resolved the bug in this updateСкрипт с открытым кодом
В истинном духе TradingView автор этого скрипта опубликовал его с открытым исходным кодом, чтобы трейдеры могли понять, как он работает, и проверить на практике. Вы можете воспользоваться им бесплатно, но повторное использование этого кода в публикации регулируется Правилами поведения. Вы можете добавить этот скрипт в избранное и использовать его на графике.
Отказ от ответственности
Все виды контента, которые вы можете увидеть на TradingView, не являются финансовыми, инвестиционными, торговыми или любыми другими рекомендациями. Мы не предоставляем советы по покупке и продаже активов. Подробнее — в Условиях использования TradingView.