OPEN-SOURCE SCRIPT
Обновлено Oscillator Spectrogram
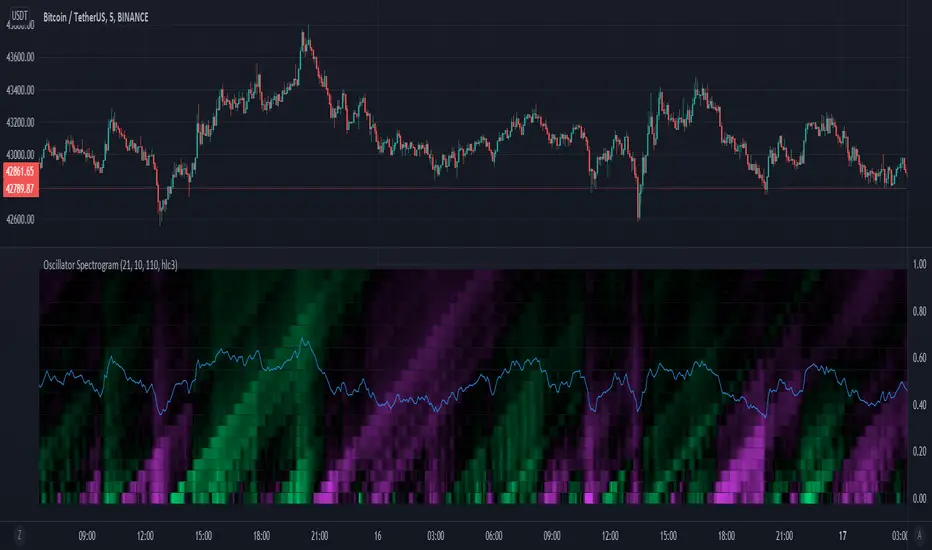
A spectrogram of simple oscillators over varying periods.
Oscillator periods increase from bottom to top.
Color indicates the value of the oscillator, with fuchsia indicating a negative value, black indicating a value around 0, and lime green indicating a value greater than 0.
The oscillators are simply the percentage of positive movement within a lookback period, with 50 percent centered at 0.
Vertical lines along the spectrogram indicate that multiple oscillators of different periods are changing values, indicating a shift in market character.
Информация о релизе
Added a line representing the average of all the oscillators.Информация о релизе
Removed accidental chart addition.Скрипт с открытым кодом
В истинном духе TradingView, создатель этого скрипта сделал его открытым исходным кодом, чтобы трейдеры могли проверить и убедиться в его функциональности. Браво автору! Вы можете использовать его бесплатно, но помните, что перепубликация кода подчиняется нашим Правилам поведения.
Отказ от ответственности
Информация и публикации не предназначены для предоставления и не являются финансовыми, инвестиционными, торговыми или другими видами советов или рекомендаций, предоставленных или одобренных TradingView. Подробнее читайте в Условиях использования.
Скрипт с открытым кодом
В истинном духе TradingView, создатель этого скрипта сделал его открытым исходным кодом, чтобы трейдеры могли проверить и убедиться в его функциональности. Браво автору! Вы можете использовать его бесплатно, но помните, что перепубликация кода подчиняется нашим Правилам поведения.
Отказ от ответственности
Информация и публикации не предназначены для предоставления и не являются финансовыми, инвестиционными, торговыми или другими видами советов или рекомендаций, предоставленных или одобренных TradingView. Подробнее читайте в Условиях использования.