PROTECTED SOURCE SCRIPT
AR–Volumized Blocks & S&D
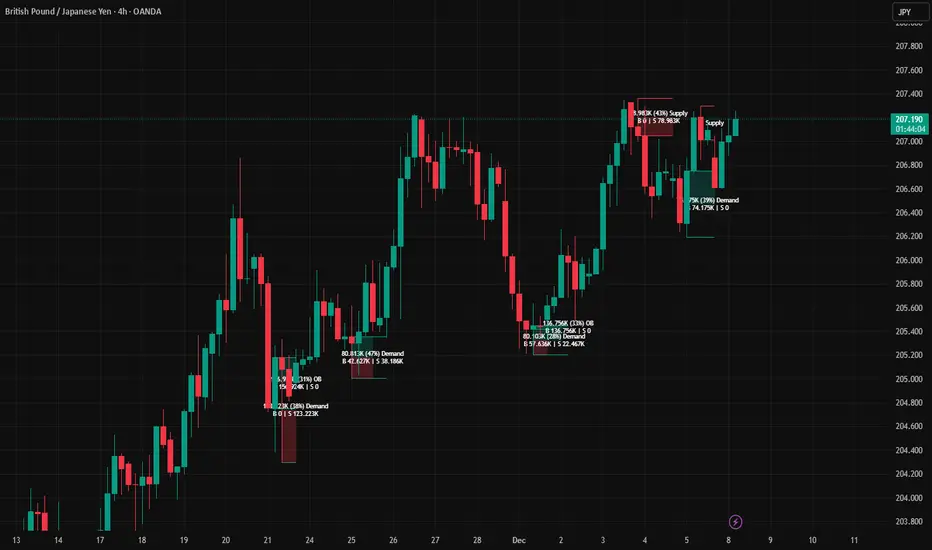
AR–Volumized Blocks & S&D is a clean, price-action order-block tool that automatically detects Bullish & Bearish Order Blocks (OB), tracks their evolving state into Mitigation Blocks (MB) and Breaker Blocks (BB), and adds a volumetric overlay showing an estimated split between buyers vs sellers inside each zone. It also includes a lightweight Supply & Demand (S&D) module with the same buy/sell visualization.
This indicator is designed to keep the chart readable: zones are drawn with thin boundaries, optional breaker fill, short reference lines, centered labels, and shortened volumetric bars (instead of huge full-width blocks).
________________________________________
What it draws
1) Order Blocks with State Tracking
Each detected Order Block is shown with:
• Top/Bottom boundaries (thin lines)
• A zone container (mostly invisible for OB/MB, semi-filled for BB)
• A label that updates live with:
o Total zone volume
o Volumetric balance %
o Current state: OB / MB / BB
o Optional extra line: Buy vs Sell estimate
States
• OB (Order Block): Newly detected zone, still valid.
• MB (Mitigation Block): Zone has been touched by price (mitigated) but not broken.
• BB (Breaker Block): Zone has been invalidated (broken through) and becomes a breaker.
Optional BB cleanup
• “Hide invalidated BB” can auto-remove breaker blocks that become invalid again (to keep the chart clean and only show active breakers).
________________________________________
2) Supply & Demand Zones
Supply & Demand zones are detected using pivot logic:
• Supply: pivot highs → zone from pivot high down to pivot candle body area
• Demand: pivot lows → zone from pivot low up to pivot candle body area
They are drawn as:
• A zone holder + thin lines
• A label (“Supply” / “Demand”), with optional volumetric text
• Optional buy/sell volumetric bars, same style as OB/BB/MB
S&D zones are removed completely once broken (clean and decisive behavior).
________________________________________
Volumetric Buy/Sell (the mini bars + text)
This script adds an extra layer called Volumetric (Buy/Sell):
-Volumetric Bars (short + clean)
Inside each zone, it can draw two small stacked bars:
• Top half: Buy volume (green)
• Bottom half: Sell volume (red)
You can choose:
• Display side (Left or Right of the zone)
• Bar length in bars (shortened by design)
• Transparency
-Volumetric Text (buyers vs sellers)
The label can optionally show:
• B 123K | S 98K
So you instantly see who dominated in that block.
Important Note (Very Honest)
These buy/sell numbers are NOT real bid/ask delta.
They are an estimate based on candle direction:
• If a candle closes green (close ≥ open) → its volume is counted as “buy”
• If it closes red (close < open) → its volume is counted as “sell”
This is still extremely useful for visual confirmation, but it is not a broker-level footprint.
________________________________________
Detection Logic Summary (simple + effective)
Order Block detection (swing-based)
• Uses a swing finder to identify relevant turning points.
• Confirms OB creation on a breakout beyond the swing level.
• Builds the OB range by walking backward to capture the strongest base candle area.
• Filters out oversized zones using ATR × Max OB height filter.
Zone lifetime handling
• Zones extend forward automatically.
• OB becomes MB on first meaningful touch.
• OB becomes BB if violated in the opposite direction.
• BB can optionally be hidden if it becomes invalid (depending on your settings).
________________________________________
Inputs & Customization
Detection
• Swing length (OB): controls sensitivity. Lower = more zones, higher = fewer stronger zones.
• Use candle body for extremes: reduces wick noise by using candle bodies for boundaries.
• ATR filter: avoids huge messy blocks (keeps zones tradable).
• Max zones to keep: keeps chart lightweight.
Visual
• Bull/Bear colors
• Label size
• Forward extension
• Short line length
• Label offset
Supply & Demand
• Enable/disable S&D
• Pivot swing length
• Forward extension, line length
• Label offset X and Y (ticks)
• Max S&D zones
Volumetric Buy/Sell
• Turn bars on/off
• Turn text on/off
• Bars side (left/right)
• Bar length (short, by bars)
• Bar transparency
________________________________________
How to use (practical workflow)
For Entries
• Use Bullish OB / Demand as a potential buy zone after a displacement up.
• Use Bearish OB / Supply as a potential sell zone after a displacement down.
• Look for confluence:
o market structure shift / BOS + displacement candle + return to OB/MB
For Bias Filtering
• The buy/sell split helps you quickly sanity-check:
o A “bullish OB” that shows heavy sell dominance might be weaker (and vice versa)
o Strong imbalance zones often show a clear dominance split
For Risk Management
• BB zones are great “line in the sand” areas.
• Use zone boundaries for invalidation, with your own model rules.
________________________________________
Performance Notes
This script is built with object limits in mind and includes:
• max_boxes_count, max_lines_count, max_labels_count
• Cleanup logic when max zones are exceeded
• Optional hiding of invalid breakers to reduce clutter
________________________________________
Disclaimer
This tool provides technical visualization and estimated volumetric info based on candle direction. It does not represent true order flow, bid/ask delta, or broker tape. Always risk-manage properly and confirm with your trading plan.
Скрипт с защищённым кодом
Этот скрипт опубликован с закрытым исходным кодом. Однако вы можете использовать его свободно и без каких-либо ограничений — читайте подробнее здесь.
Отказ от ответственности
Информация и публикации не предназначены для предоставления и не являются финансовыми, инвестиционными, торговыми или другими видами советов или рекомендаций, предоставленных или одобренных TradingView. Подробнее читайте в Условиях использования.