OPEN-SOURCE SCRIPT
Zone Color Pattern

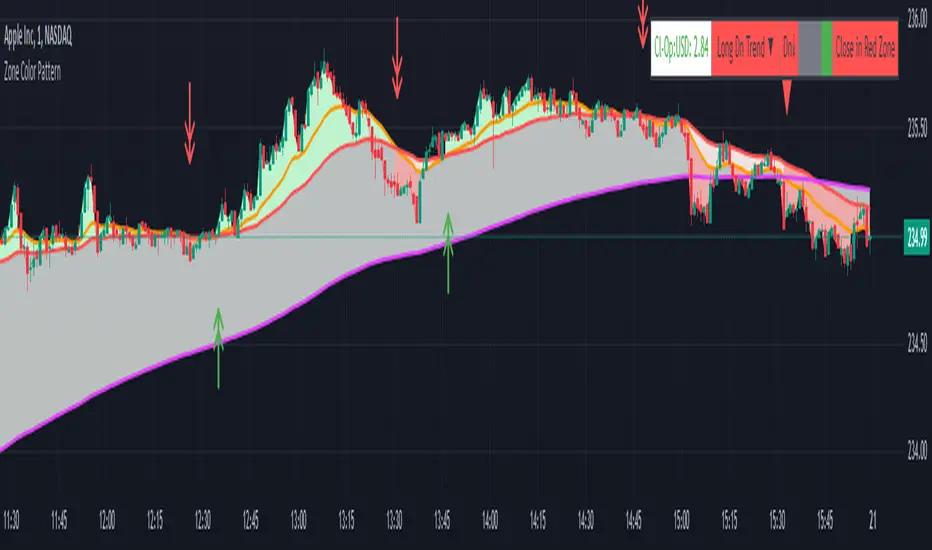
Zone Color Pattern indicator depicts the color pattern of zones on chart. This will help the user to identify the zones on Chart.
Green Zone is indicated by Green color.
Red Zone is indicated by Red Color.
Gray Zone is indicated by Gray Zone.
Zone Color Pattern indicator is based on 3 moving averages. Long term, Medium term and Short Term.By default they are 200, 50 and 20.
When you are on long term trend the position of MAs is 20 MA is on top,then comes 50 MA and 200 MA is positioned below 50 MA.The position of respective MAs change during down trend.
The color patterns display the distance between different MAs .The widening and contraction of space between different Moving Averages indicate the movement and direction of price.
Basically price tend to move in and move away from Average. This action tend to create a space between price and MAs.Color patterns between price and MAs reflect the gap between the price and M|As .All these effects can be visualized on chart in relevant colors to infer the status of price, movement, cross over by the User.
Buy trades are preferred when close is in Green Zone and price is above MA20.
Sell trades are preferred when close is in Red Zone and price is below MA20
Trades may be avoided when close is in Gray Zone.
Long Up Trend and Down Trend respective color triangle shapes and arrows on chart indicate the trends and direction.
The chart understanding has to be supplemented with other regular indicators along with appropriate risk reward techniques by user.
Table indicate difference between Last Price traded and Day open price.
Other columns in table display the position of close in different Zones.
DISCLAIMER: For educational and entertainment purpose only .Nothing in this content should be interpreted as financial advice or a recommendation to buy or sell any sort of security/ies or investment/s.
Скрипт с открытым кодом
В истинном духе TradingView, создатель этого скрипта сделал его открытым исходным кодом, чтобы трейдеры могли проверить и убедиться в его функциональности. Браво автору! Вы можете использовать его бесплатно, но помните, что перепубликация кода подчиняется нашим Правилам поведения.
Отказ от ответственности
Информация и публикации не предназначены для предоставления и не являются финансовыми, инвестиционными, торговыми или другими видами советов или рекомендаций, предоставленных или одобренных TradingView. Подробнее читайте в Условиях использования.